This crypto indicator turned green
A bullish divergence in Bitcoin’s price and RSI level … a technical indicator is flashing green … what history says about Bitcoin returns going forward …
There is something bullish going on in crypto.
Although the price rally that pushed Bitcoin up more than 40% so far this year appears to be stalling, there is a lot going on under the hood.
Investors would do well to take note. If history repeats itself, significant gains are in store.
To understand what’s going on, let’s start by evaluating Bitcoin’s relative strength index (RSI) level.
This is a momentum indicator that measures the extent to which an asset is overbought or oversold. A reading above 70 suggests an asset is “overbought” (and likely poised for a pullback), while a reading below 30 means it is “oversold” (and poised for positive gains).
With that context, let’s turn to our resident crypto expert Luke Lango Crypto Investor Network. From his latest update:
Bitcoin was wildly overbought at the start of the 2023 rally.
At the end of January, the relative strength index of BTC reached 91.2. That’s almost as high as BTC’s RSI has ever been, meaning that at the end of January, BTC was about as overbought as it’s ever been.
Every single time BTC’s RSI got that high, the crypto market went through a short-term pullback.
However, whenever BTC’s RSI has come above 90 lately, cryptos were in a boom cycle.
In fact, Bitcoin has never reported a 90-plus RSI and not been in a boom cycle.
Also, the first RSI reading above 90 tends to mark the beginning of a boom cycle, with huge returns to follow.
We just recorded the first RSI reading of 90 plus in this cycle. History says that after a brief pullback, this is consistent with the start of a massive crypto market rally in 2023.
Let’s add an extra wrinkle.
We see a bullish inconsistency between Bitcoin’s price and the RSI level
When the RSI levels become overextended in either direction, a mean reversion usually follows.
So we tend to see an asset price shoot higher if the RSI has been deep in oversold territory, or an asset price falls sharply after becoming heavily overbought.
As Luke just pointed out, Bitcoin has been grossly overbought. And if we look at the RSI for the last few days, it has fallen hard.
But Bitcoin’s price has held up far better.
Take a look at this divergence.
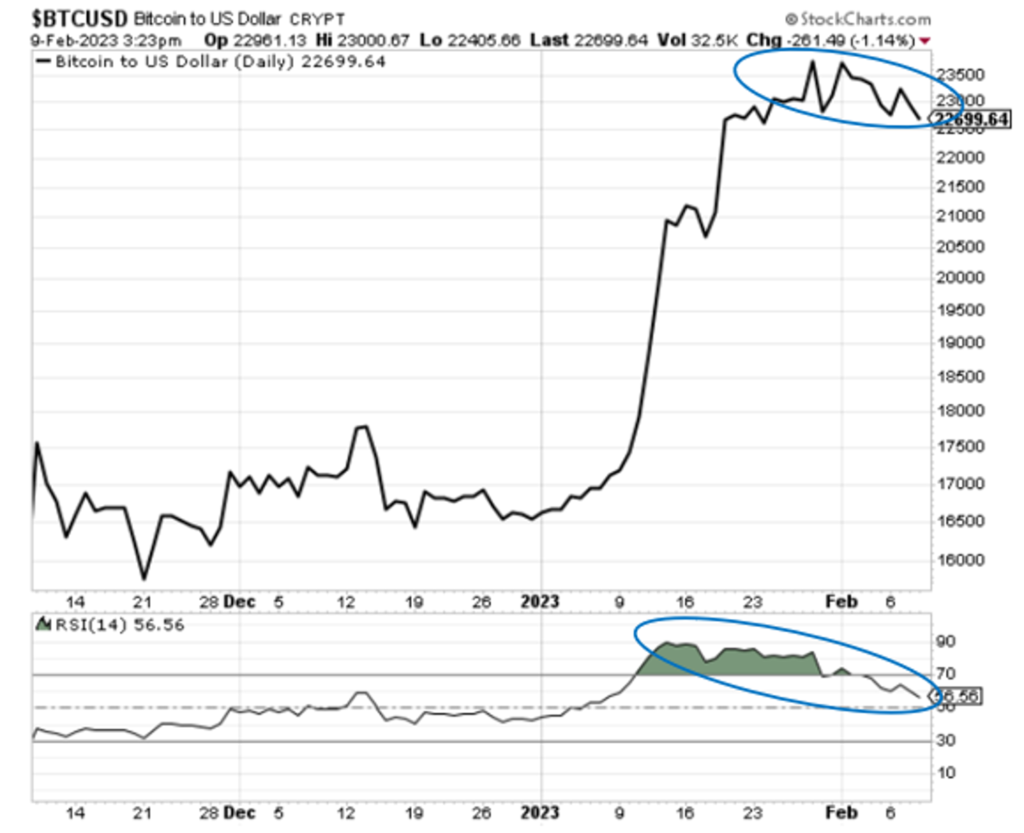
Source: StockCharts.com
Bitcoin’s RSI has fallen from 91 to 57 as I write. That’s a big bleed – a drop of almost 38%.
Additionally, “50” is a neutral reading. Bitcoin’s RSI is not far off.
Meanwhile, Bitcoin’s price has only fallen from a recent peak of $24,199 to $22,699 as I write. This is a decrease of 6%.
To be clear, an asset’s RSI level and its price do not move in lock step or in the same proportion. We shouldn’t expect that.
But the decline in Bitcoin’s RSI has far outpaced the associated decline in price.
So, what does that really mean?
A few things…
Bitcoin is holding its new overall price level as technical strength builds beneath the surface… conditions are developing where there is plenty of “overhead space” on Bitcoin’s RSI chart for another bullish rise before reaching overbought conditions again… and investors are ‘t take profits because of the expectation of even greater gains.
We’ve just seen a technical event that suggests these bullish expectations are likely to come true
Traders have all kinds of tools and indicators they refer to to give them insight into the market.
Of all their options, “moving averages” rank high on the list.
A moving average (MA) is what it sounds like – it is the “average” of a number of previous days’ worth of asset prices.
For intermediate and long-term traders and investors, the slope of the 50-day, 100-day and 200-day MAs is regularly referenced. They provide clues about an asset’s short- and long-term trend and momentum.
Now traders also analyze the interaction between these MAs themselves because this information also provides clues. For example, there is a bullish signal called a “Golden Cross”.
This term describes the dynamic where the short-term 50-day MA pushes north through the long-term 200-day MA.
Many traders see this as evidence of a long-term regime change in the market, from bearish to bullish.
And that’s what just happened with Bitcoin…
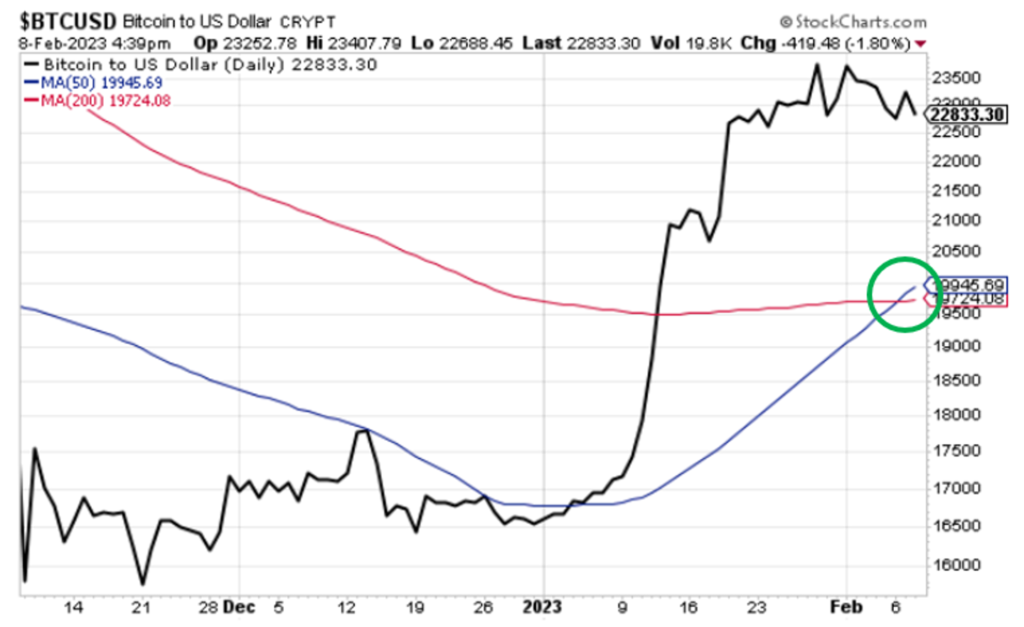
Source: StockCharts.com
This alone does not mean that a bull market is guaranteed. Pressure on Bitcoin’s price could cause the 50-day MA to fall back below the 200-day MA.
But if this golden cross holds, which becomes more likely the longer Bitcoin’s price remains stable while the RSI level declines, the better the chance we’ll see a true bull forming.
If Bitcoin Enters Another Bull Market, What Can We Expect From 2023?
Let’s go back to Luke:
Bitcoin almost always recovers between 38% and 50% of its losses in the first year of a boom cycle, which almost always correlates with the 12 months before a BTC halving event.
It seems history is destined to repeat itself.
BTC’s early 2023 uptrend is consistent with the token rising to $40,000 by the end of this year.
That would be a nearly 50% retracement of BTC’s losses in the first year of the boom cycle and in the 12-month window before the fourth halving.
If Bitcoin reaches $40,000 by the end of the year, it will mean a gain of more than 75% from today’s price.
If the Fed halts its rate hikes, history suggests crypto gains are in store
Luke writes that we are seeing a new Jerome Powell. He is noticeably more dove-like than he has been in the past.
This shift began at his press conference after the FOMC meeting last week.
As Luke points out, Powell said the cycle of disinflation has begun. It is a sentimental and rhetorical turning point, setting the stage for a political pivot in the next three months.
Now the stock market erupted in the wake of Powell’s comments as complacency took over some traders.
Powell clearly saw this reaction, so he had the opportunity to talk down this bullish response at his press conference on Tuesday. That was when Powell spoke at the Economic Club of Washington.
It didn’t happen. Instead, Powell repeated largely the same message that disinflation was beginning.
Yes, he included a lot of hedging language, but Powell didn’t go back to “full hawk” like we’ve seen him before. That in itself was due.
So if/when we finally see the long-awaited Fed “pause” this spring, what are the implications for Bitcoin?
Luke writes that the last time the Fed stopped a rate hike campaign, Bitcoin rose.
Here is the accompanying chart he provided his readers.
If you’re having trouble seeing that, Luke points to December 2018, which is when the Fed stopped raising rates during that hike cycle.
It coincided with the beginning of the 2019 Bitcoin bull market – and in an even longer term, the bull that peaked in 2021.
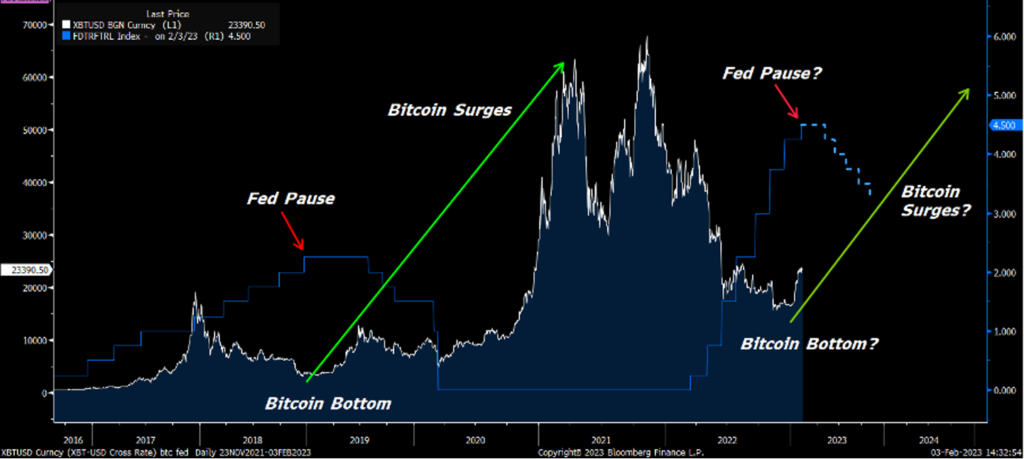
Source: Bloomberg
Put it all together, and it reinforces Luke’s belief that the crypto bear is over
Yes, prices take a breather and may pull back and consolidate in the short term. It’s a normal and even healthy part of a bull market.
But an increasing number of bullish signs are flashing today. It’s time to start paying attention.
Back to Luke:
While [last] week was not another explosive upside week for cryptos, we believe it provided further technical and fundamental confirmation that a new crypto boom cycle has indeed begun.
We waited for this confirmation to issue new buy alerts. That confirmation has now arrived.
Therefore, we are now just putting the finishing touches on a new round of crypto buy alerts and fully expect to issue new buys in the month of February.
To join Luke Crypto Investor Network to access these new purchases, click here. Otherwise, pay attention to this brewing bullishness. A shift is happening.
We will keep you updated.
Have a nice evening,
Jeff Remsburg


