The future of Bitcoin price after the last 10% drop
Bitcoin (BTC) price fell sharply after creating a bearish candlestick last week, breaking down from a short-term pattern in the process.
Bitcoin price may have reached a local peak, which means a significant correction is imminent. However, the price started to jump yesterday. How does it fit into the long-term movement?
BTC Price Fails to Clear Decisive Resistance
Bitcoin price fell sharply last week creating a bearish engulfing candlestick. This is a type of bearish candlestick where the price negates the entire previous period’s gains. It is confirmed with a closing during the opening of the previous period.
Also, the candlestick validated the horizontal area of $31,000 as resistance (red icon). This is a crucial resistance level as it previously provided support since early 2021.
As a result, failing to reclaim it is considered a huge sign of weakness. If the price were to break out, the area would be expected to provide support again. But because of the rejection, the area still acts as resistance. If the decline continues, the nearest support area will be at $25,000.
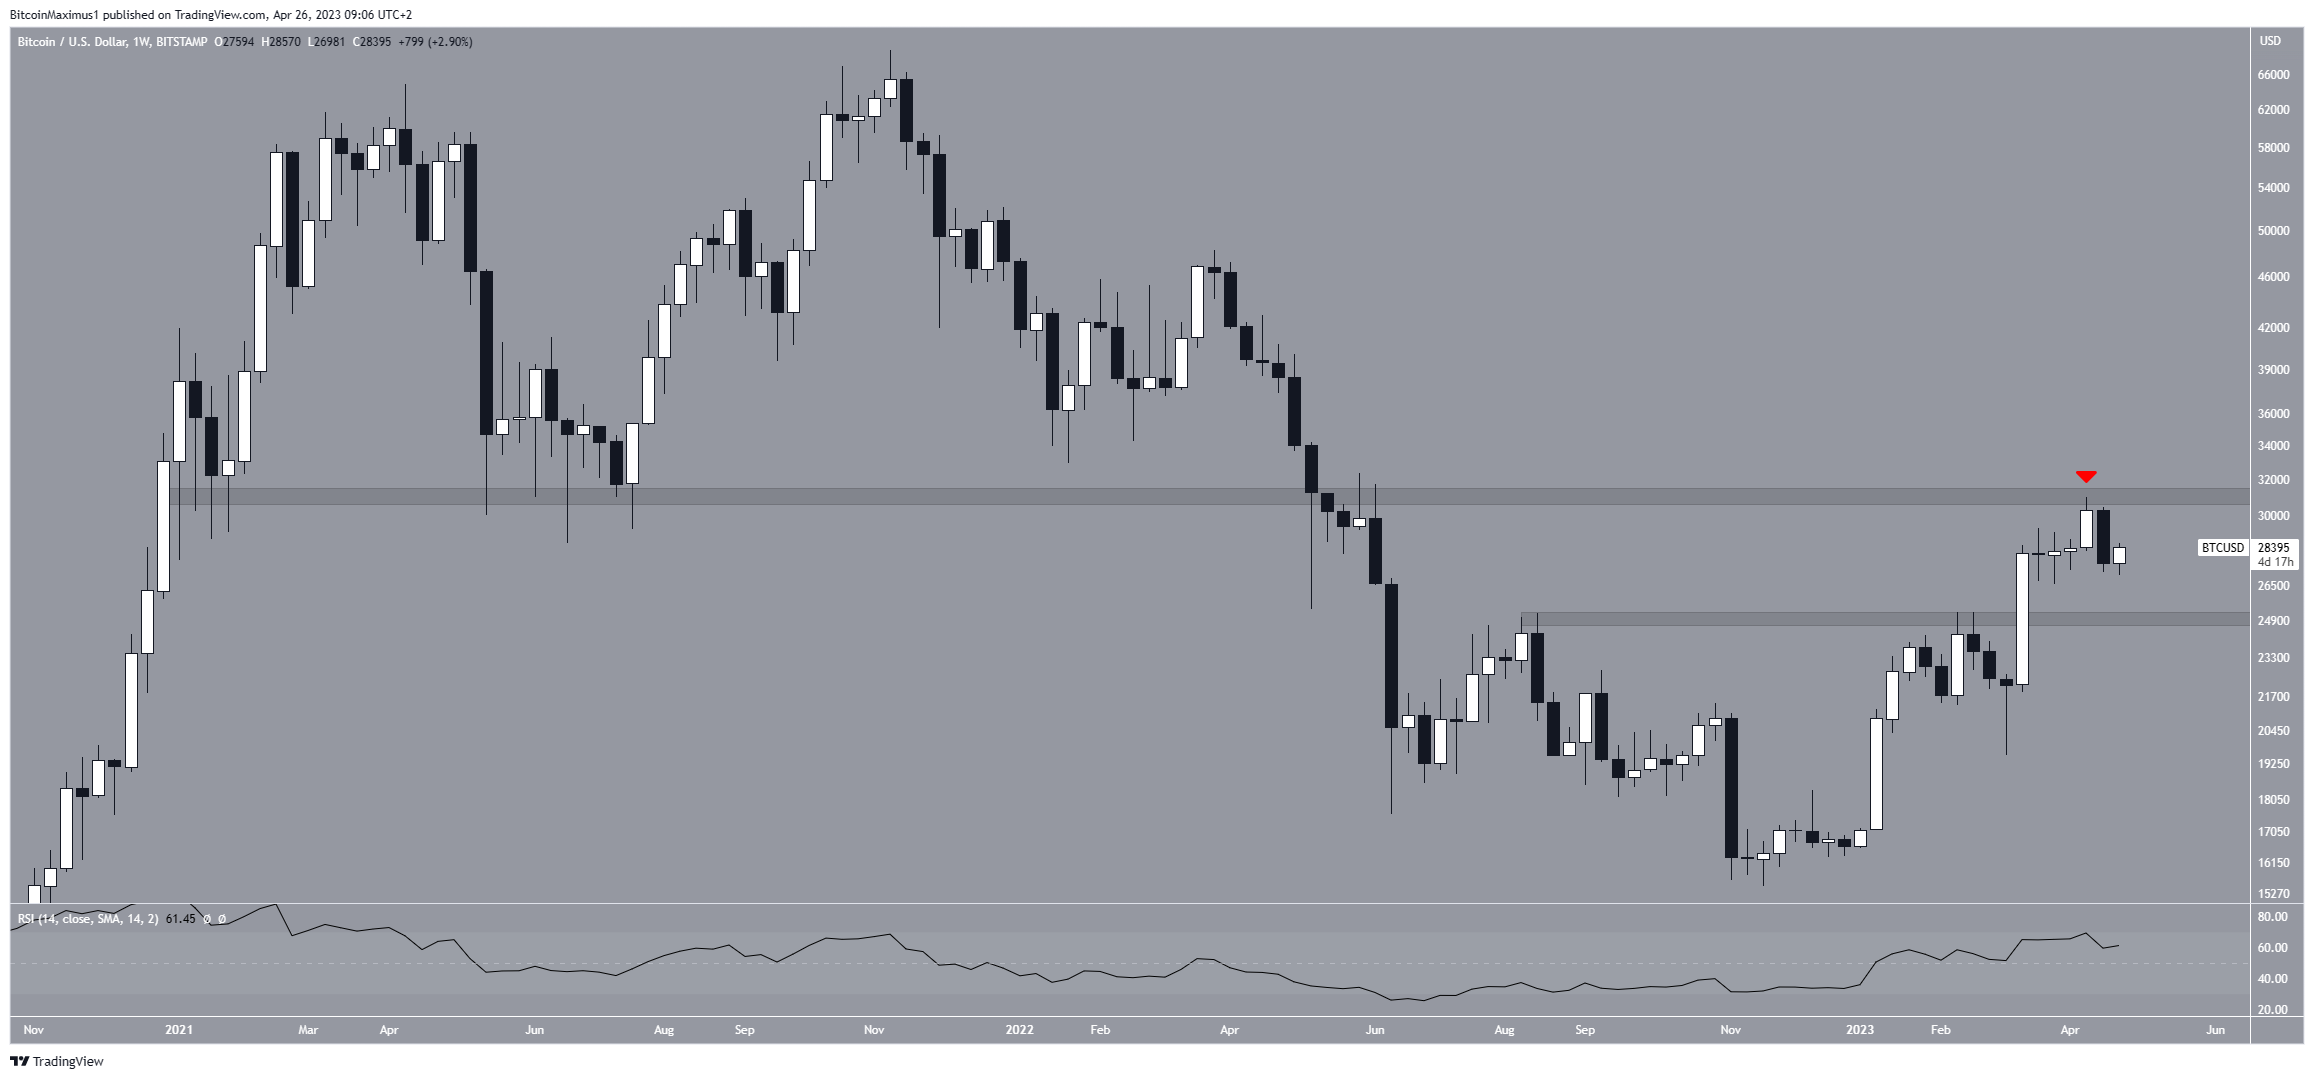
Despite the rejection, the weekly Relative Strength Index (RSI) remains bullish, as it is above 50 and rising. Ttraders use the RSI as a momentum indicator to assess whether a market is overbought or oversold, and to decide whether to accumulate or sell an asset. If the RSI reading is above 50 and the trend is up, bulls still have an advantage, but if the reading is below 50, the opposite is true.
Bitcoin Price Prediction: Is This The First Part Of The Correction?
The technical analysis from the daily timeframe provides a bearish Bitcoin price prediction. There are two main reasons for this.
First, the price broke down from a rising parallel channel. The rising parallel channel is a type of corrective pattern where the price moves within parallel resistance and support lines before finally breaking down. Since the channel is facing upwards, it means that the dominant trend is downward, hence bearish.
Subsequently, the daily RSI has generated a bearish divergence (green line). This is a type of event where a similar increase in momentum does not accompany the increase in price. Downward movements often follow it, as was the case in BTC.
Due to these readings, the most likely future price scenario is to validate the channel as resistance, probably at $29,500, before resuming the downward movement. The height may be reached within the next 24 hours.
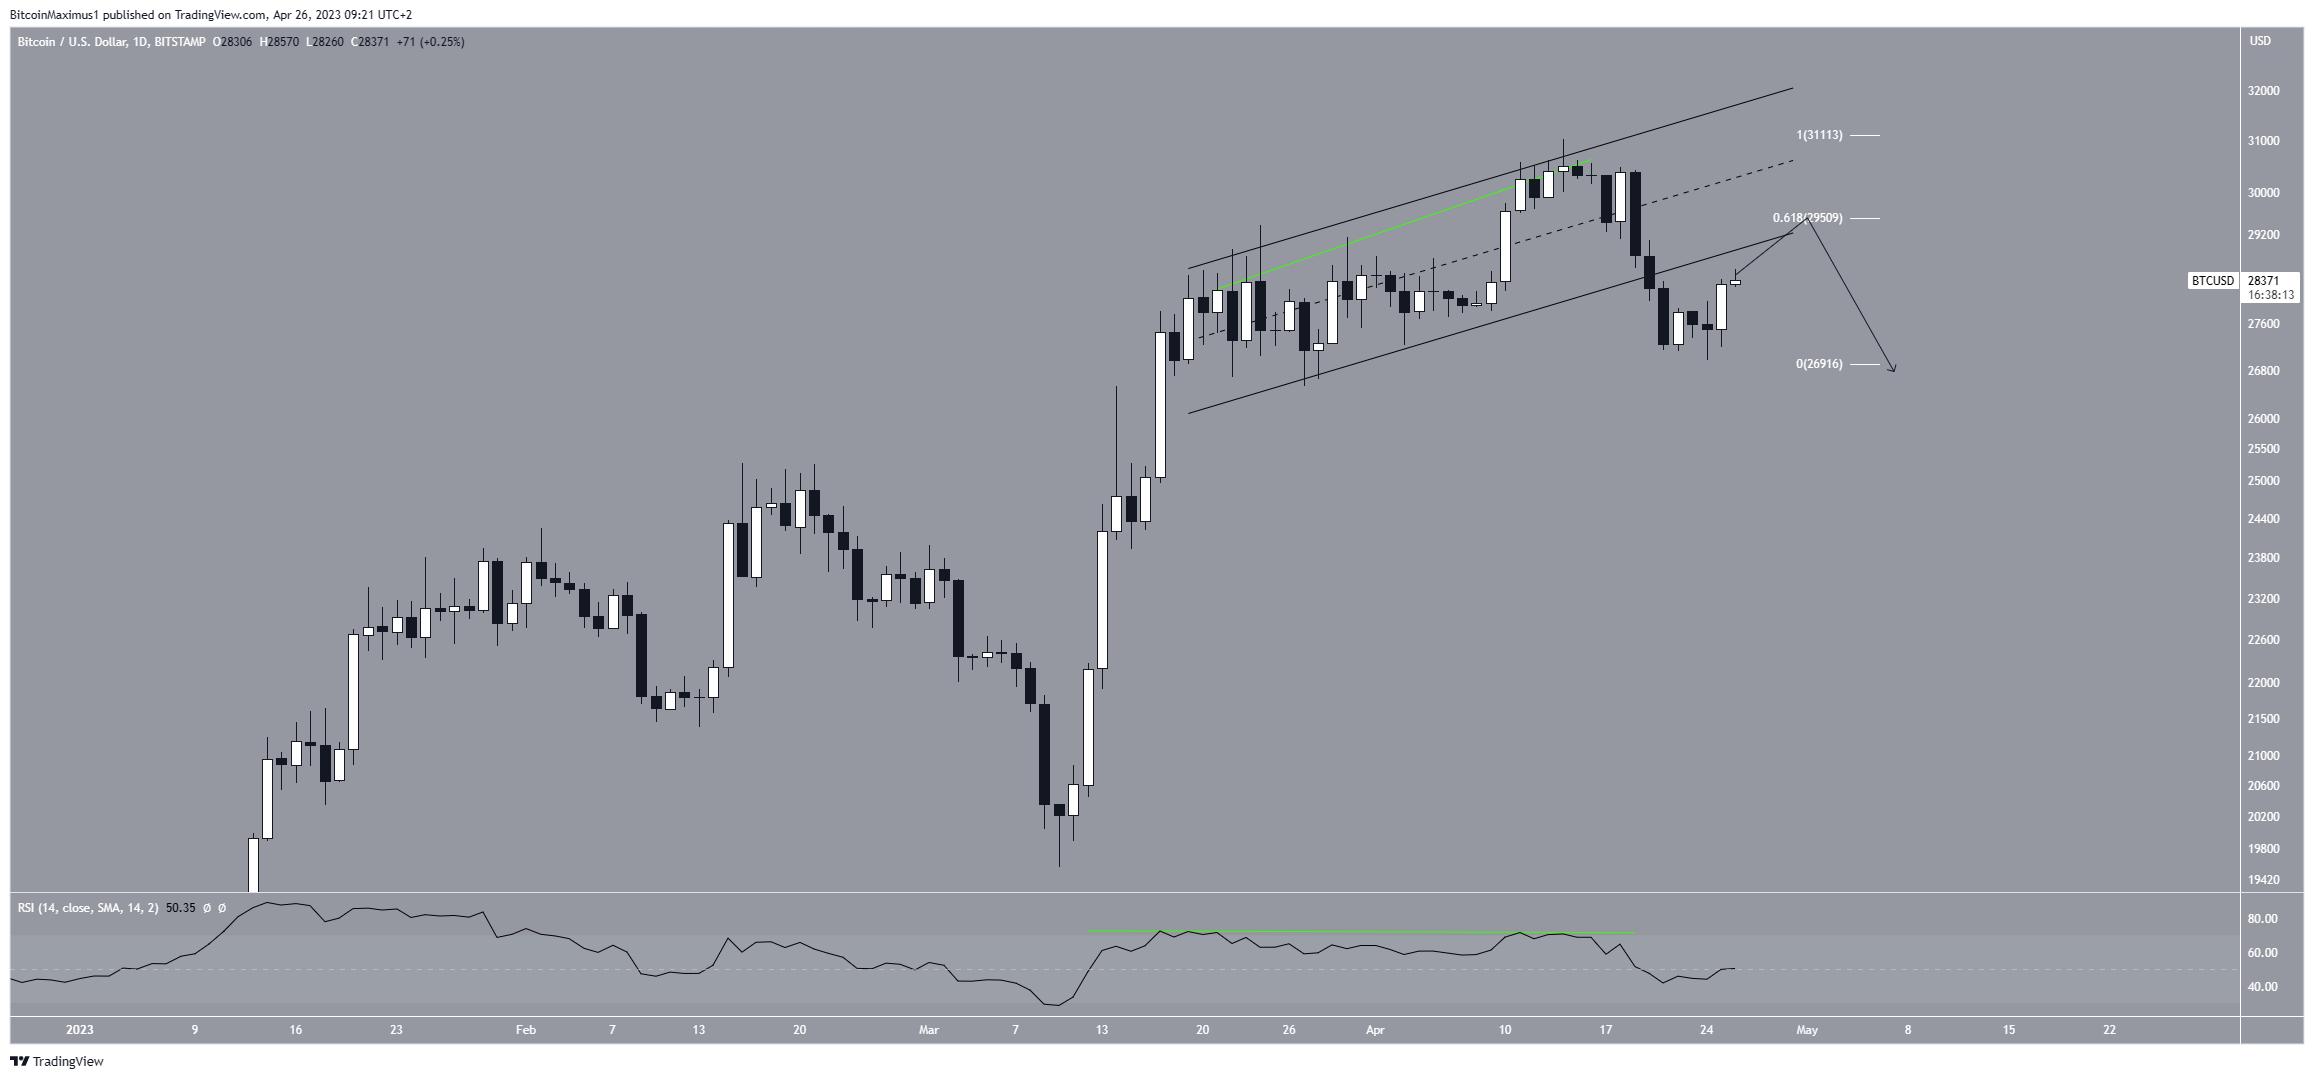
On the other hand, a move above the annual high of $31,000 would invalidate this bearish outlook. Since it would also cause a breakout from the long-term resistance area of $31,000, it could lead to a quick pump to the next resistance at the average price of $46,000.
For BeInCrypto’s latest crypto market analysis, click here
Disclaimer
In line with Trust Project guidelines, this price analysis article is intended for informational purposes only and should not be considered financial or investment advice. BeInCrypto is committed to accurate, objective reporting, but market conditions are subject to change without notice. Always do your own research and consult with a professional before making any financial decisions.


