The Bitcoin bottom is close, but a drop down to this level is possible
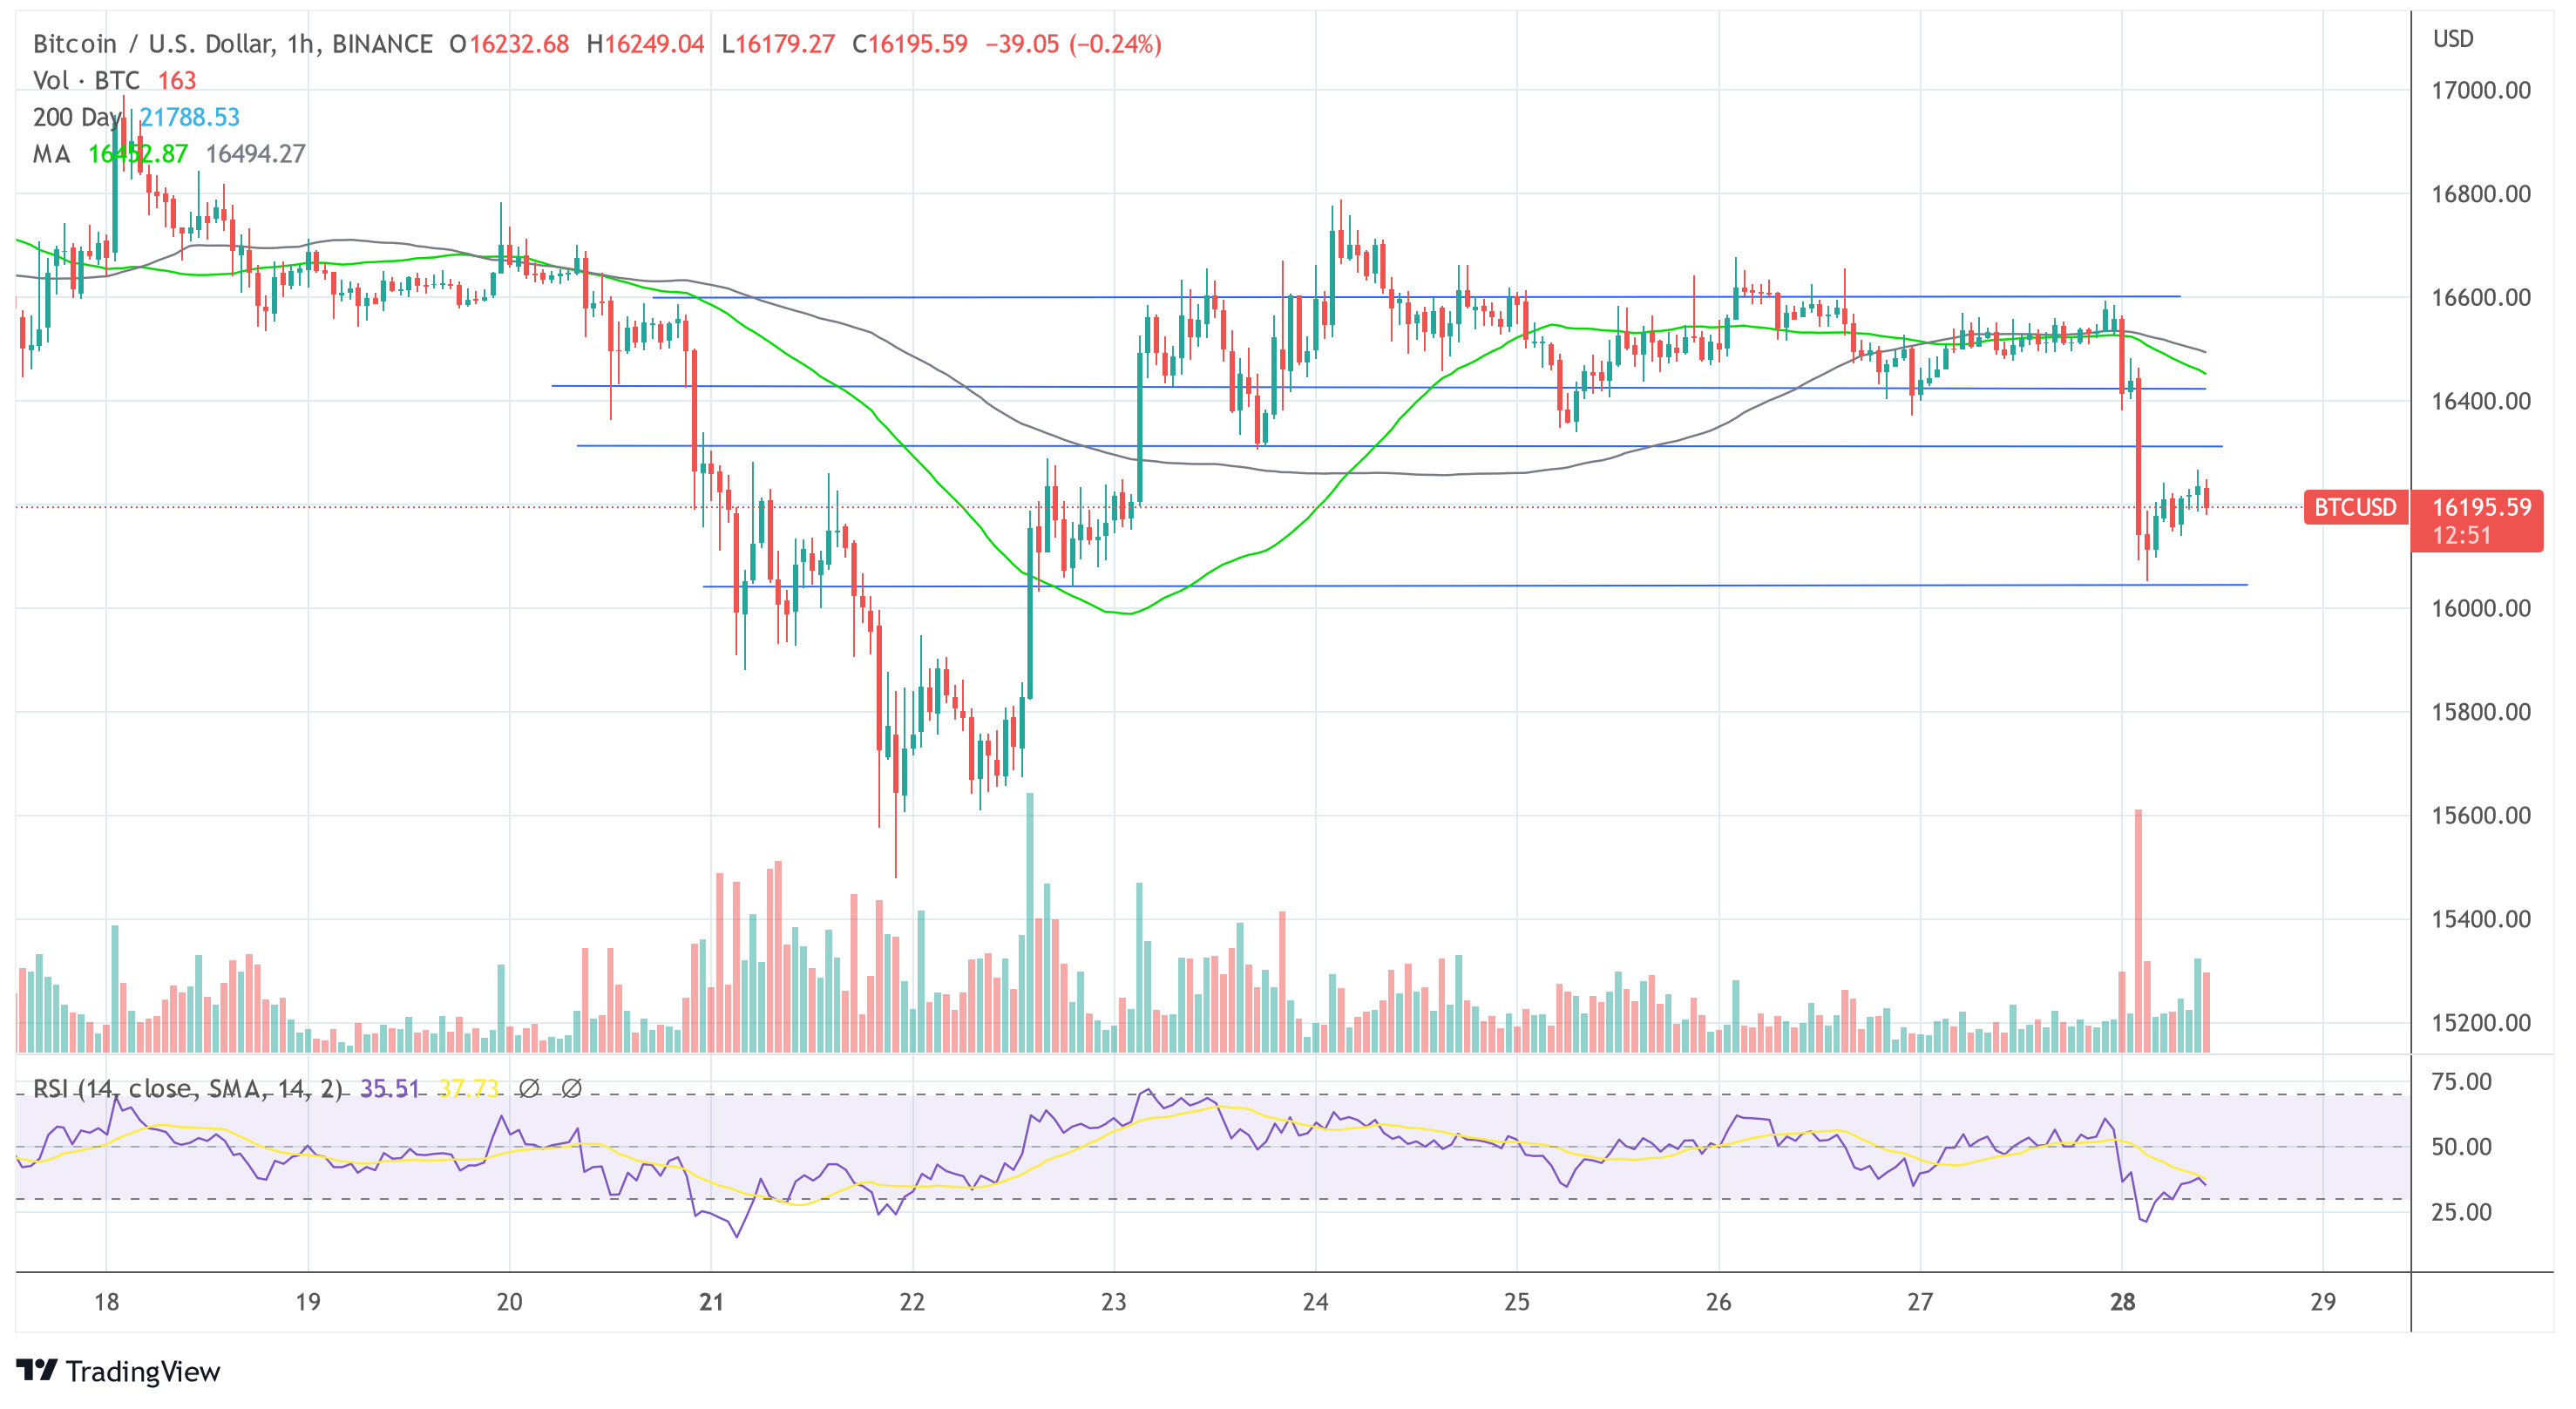
After Bitcoin failed to sustainably overcome the key $16,600 resistance over the past five days, the price experienced a renewed decline a few hours ago.
A week ago, on November 21, the BTC price fell to a new bear market of $15,480, after which the price saw a peak, which, however, came to an abrupt end, questioning the strength of the bulls.
At press time, BTC was trading at $16,195 and initially found support at $16,050. If the nearest resistance at $16,310 does not bounce back to support, a retest of the current bear market low could be on the cards.
Bitcoin Bottom Still not in?
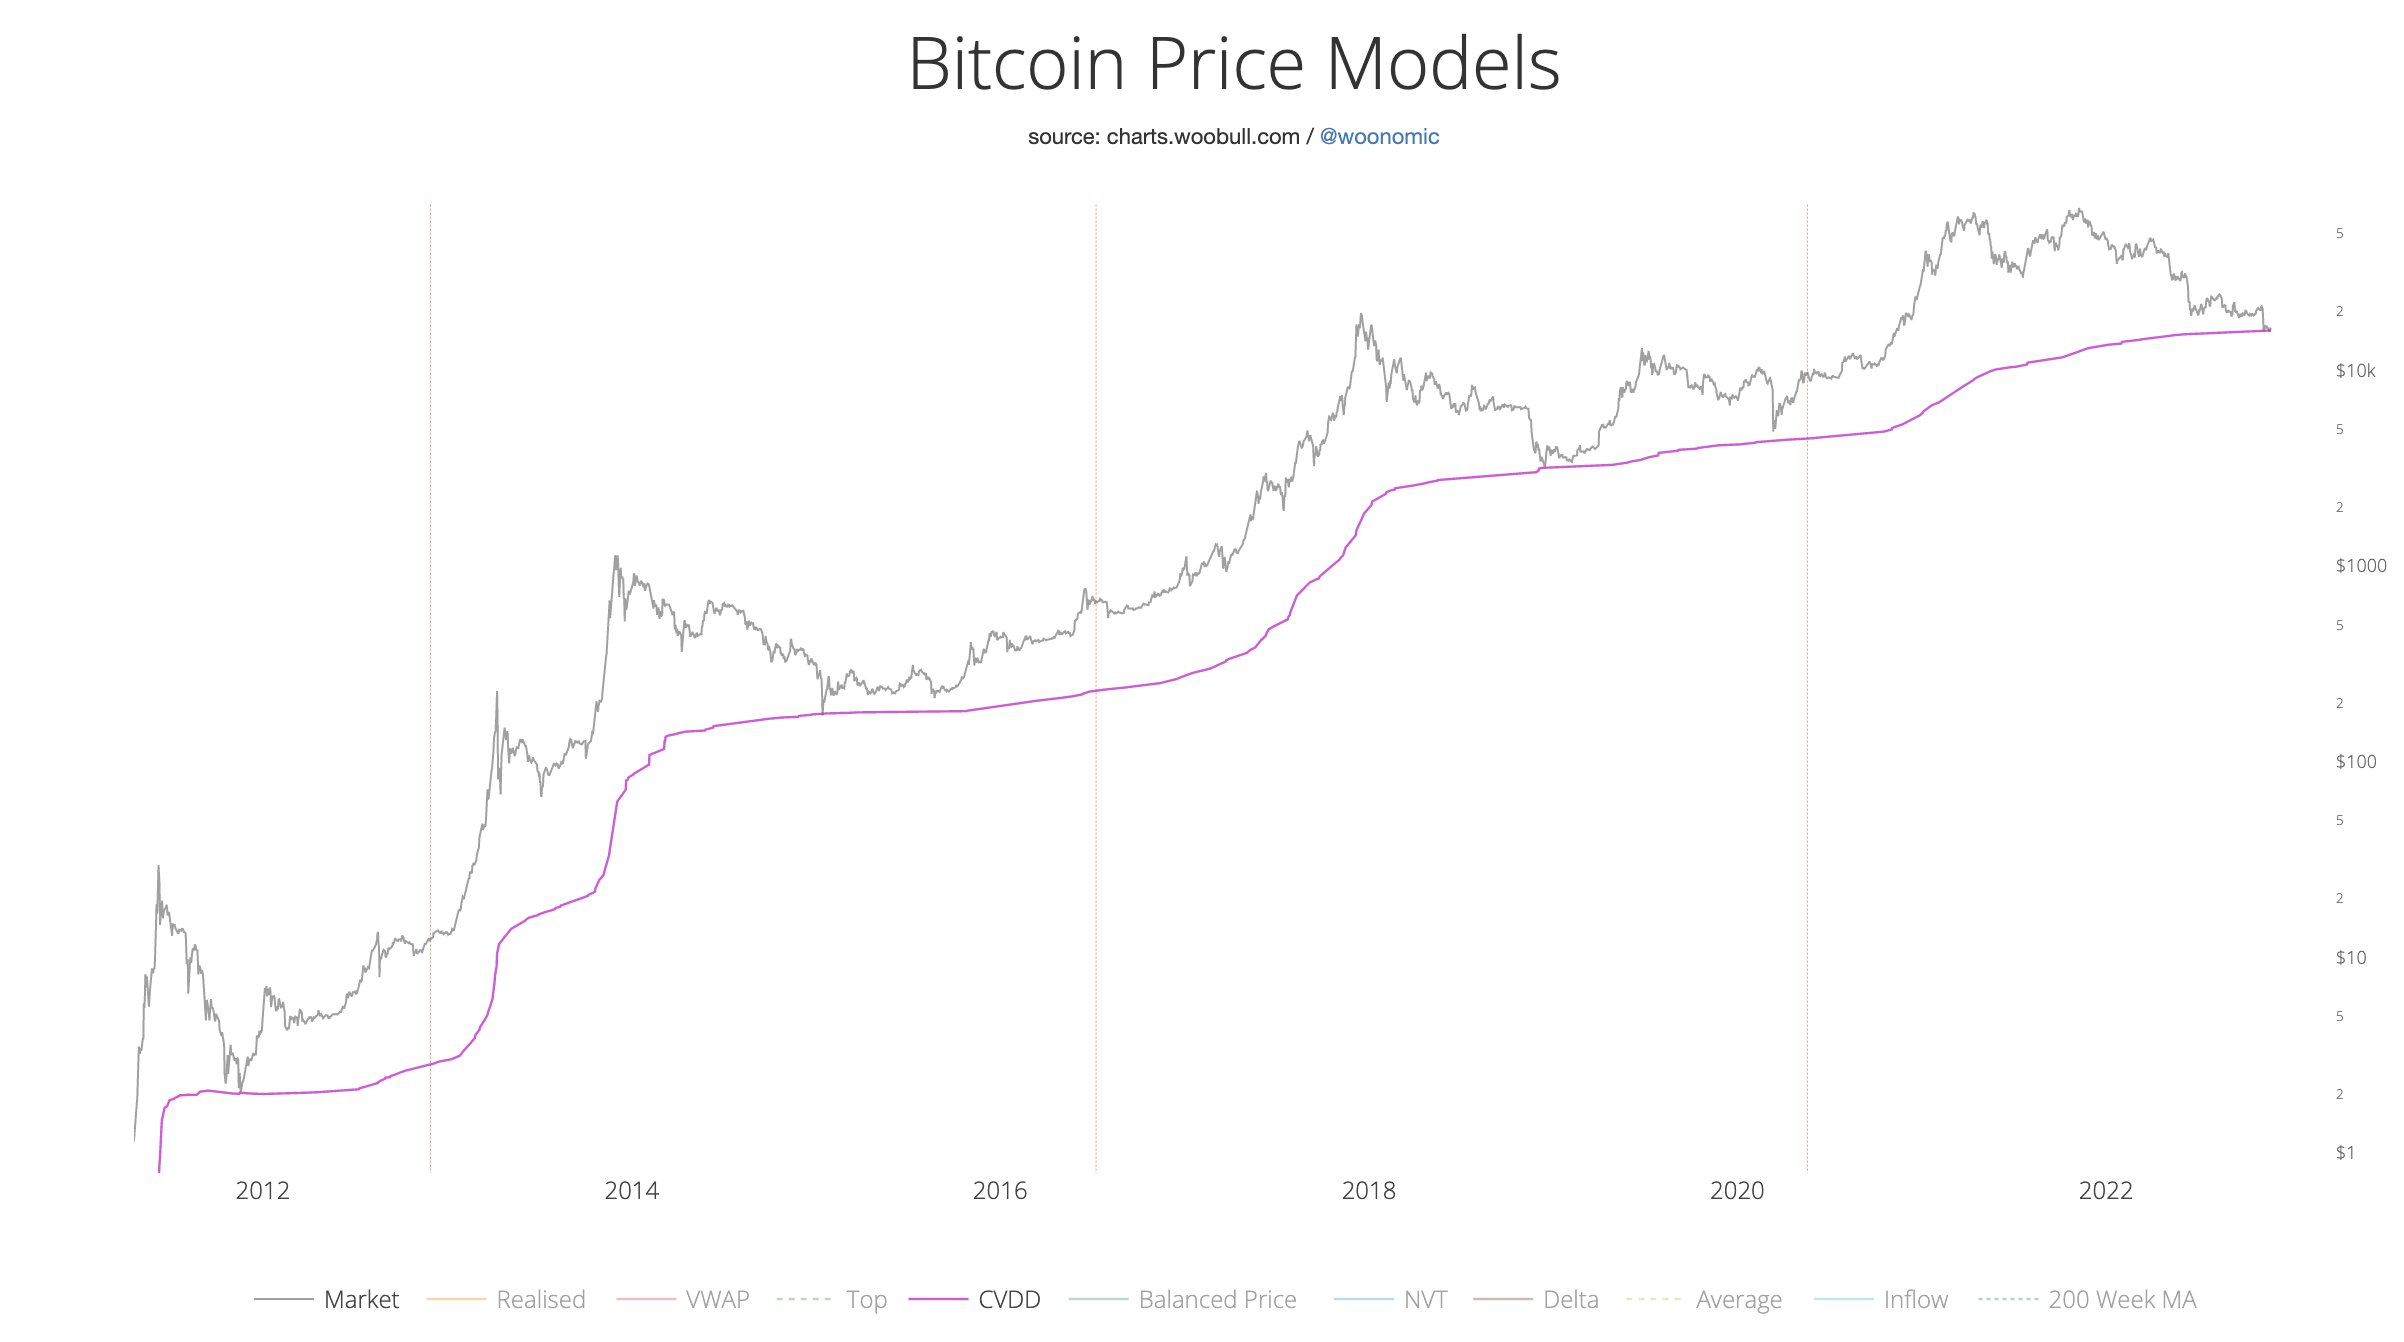
Meanwhile, well-known chain analyst Willy Woo has told his 1 million followers that a Bitcoin bottom may be near. The analyst uses three on-chain data models to reach this conclusion.
As Woo writes, the CVDD floor price is currently being tested. The model examines alternatives to the market price. Dotted lines mean that the model is purely technical, which means that it only uses the market price as an input. Solid lines include metrics that come from the blockchain, meaning they include investor, network, and user behavior fundamentals.
Ultimately, the model created by Woo in April 2019 uses the age and value of Bitcoin moving to new investors to create a floor. Woo’s theory: “When significant old coins (eg bought at $100) pass to new investors (eg $16k), the market perceives a higher floor.”
At the moment, the model with a proven track record shows a new test.
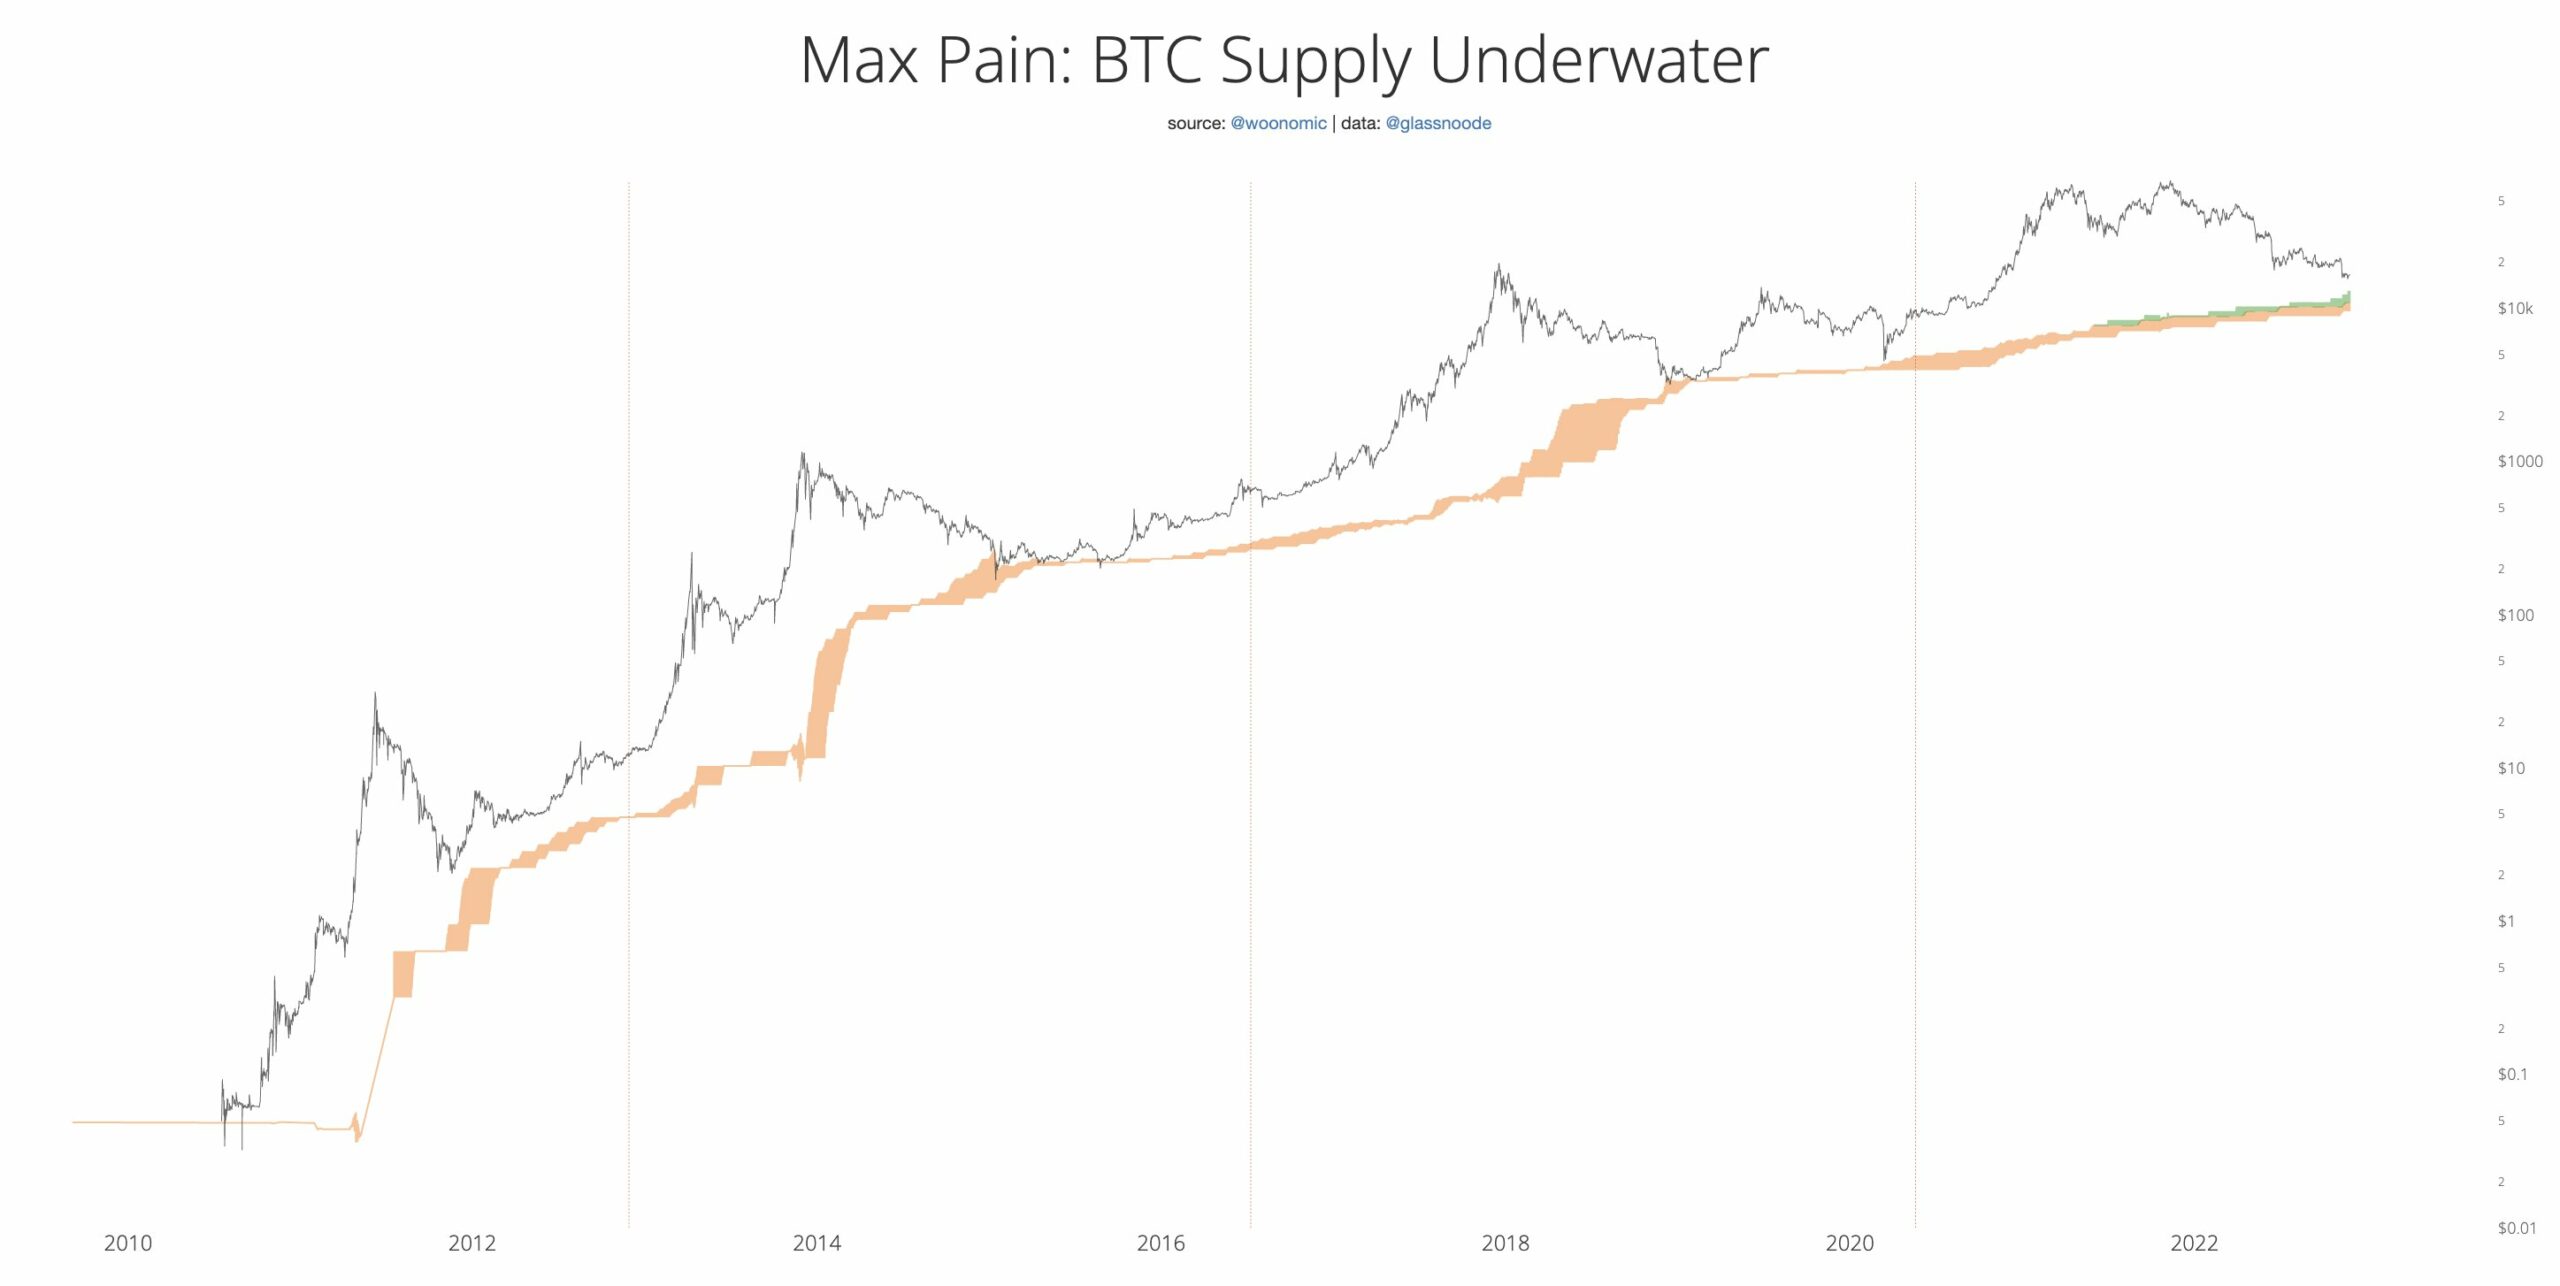
The Max pain model also signals that the Bitcoin bottom is getting closer. Historically, the Bitcoin price reaches the bottom of a macro cycle when 58%-61% of coins are in the loss zone. Every time the price has fallen into the green zone, it marked a floor.
“The upper limit of the shaded area is at 13k and rising rapidly,” Woo said. Thus, another price drop could be possible, although the analyst also emphasized that not all lows were reached, with “those that were not close.”
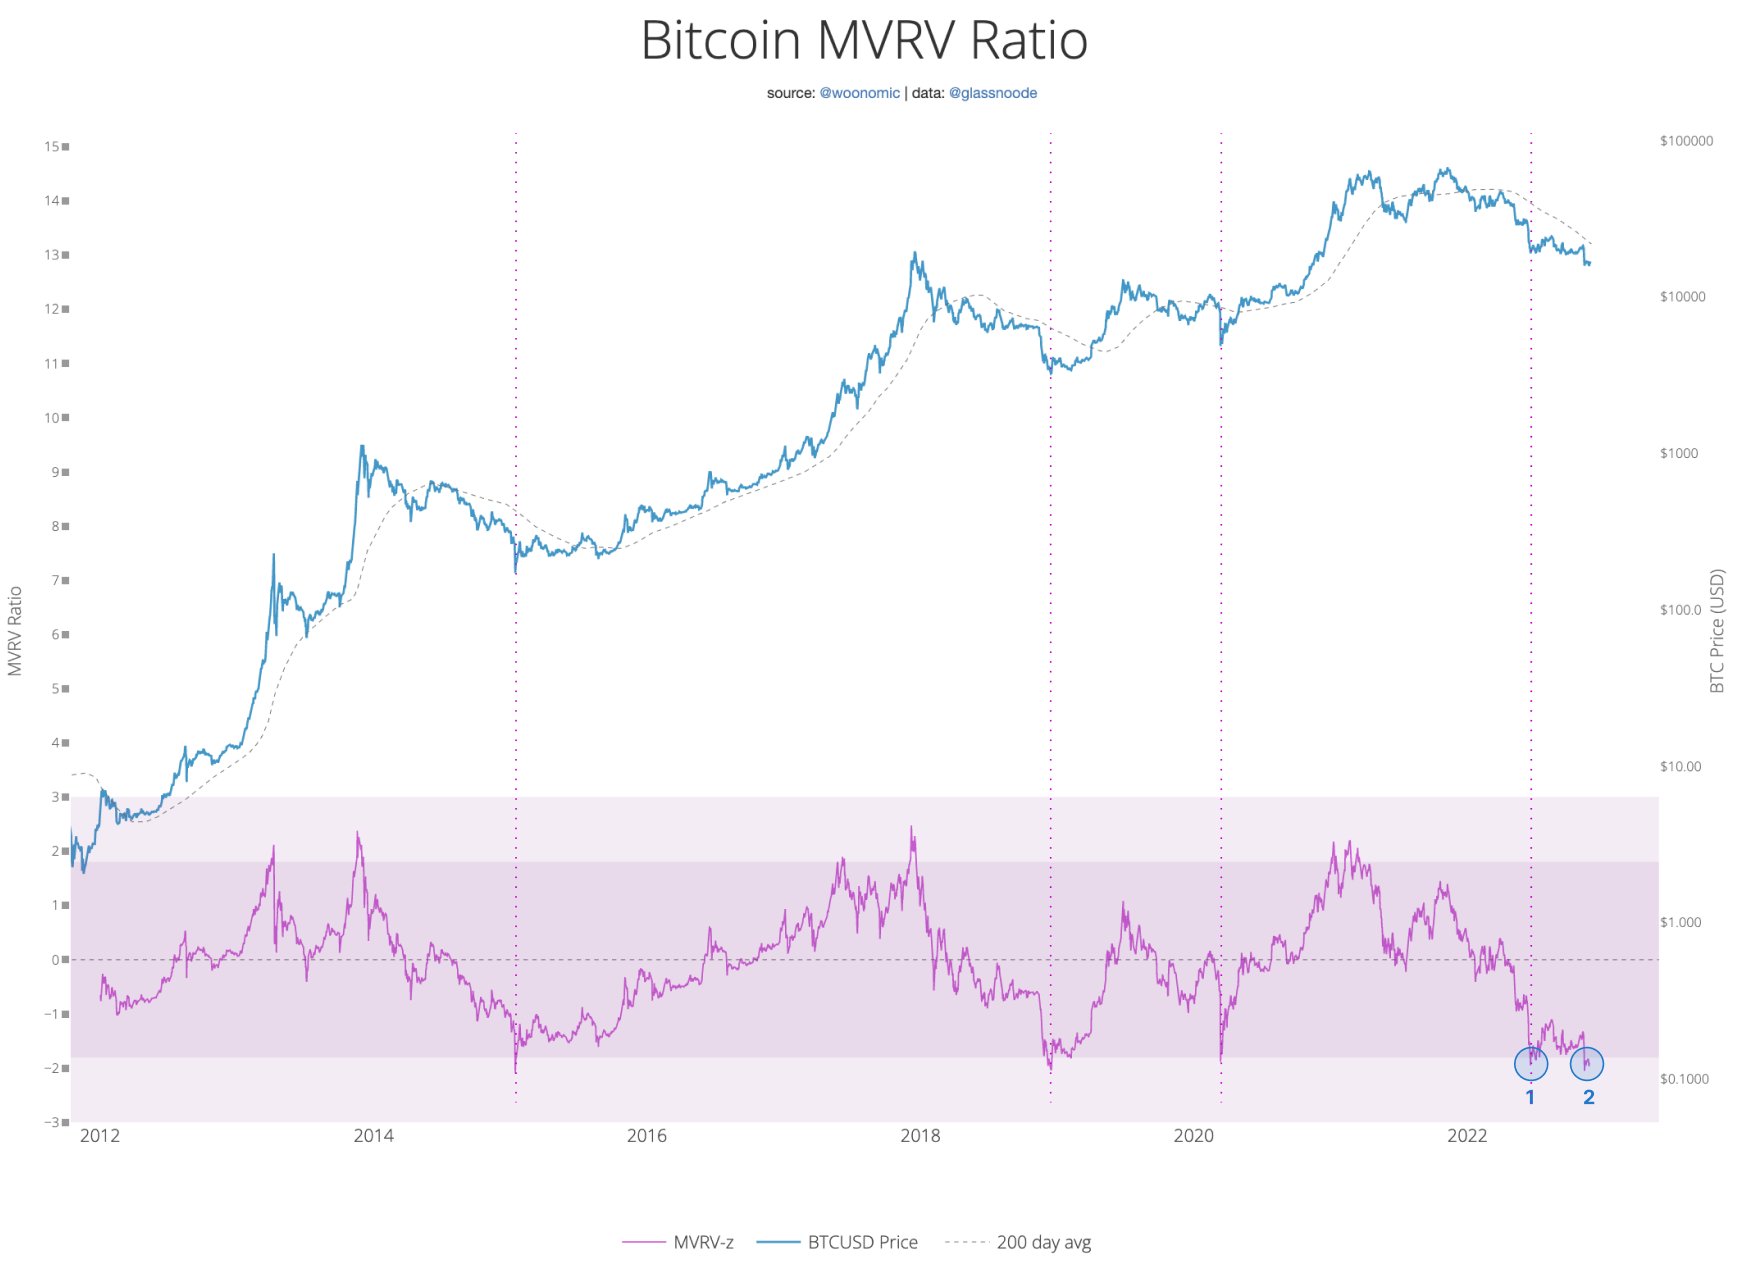
Third, Woo looked at the MVRV ratio. This represents the ratio between market value and realized ceiling. The purpose is to show when the exchange-traded price is below “real value” and to identify highs and lows in the market. Analyzing the MVRV ratio, Woo says:
The MVRV ratio is deep in the value zone. Under this signal we were already at the bottom (1) until the latest FTX white swan debacle brought us back to a buy zone (2).
Overall, Woo sees the possibility that the bottom could mean a little more pain for Bitcoin investors. He also points out that the market is in an “unprecedented downsizing scenario”, and puts all models to the test.
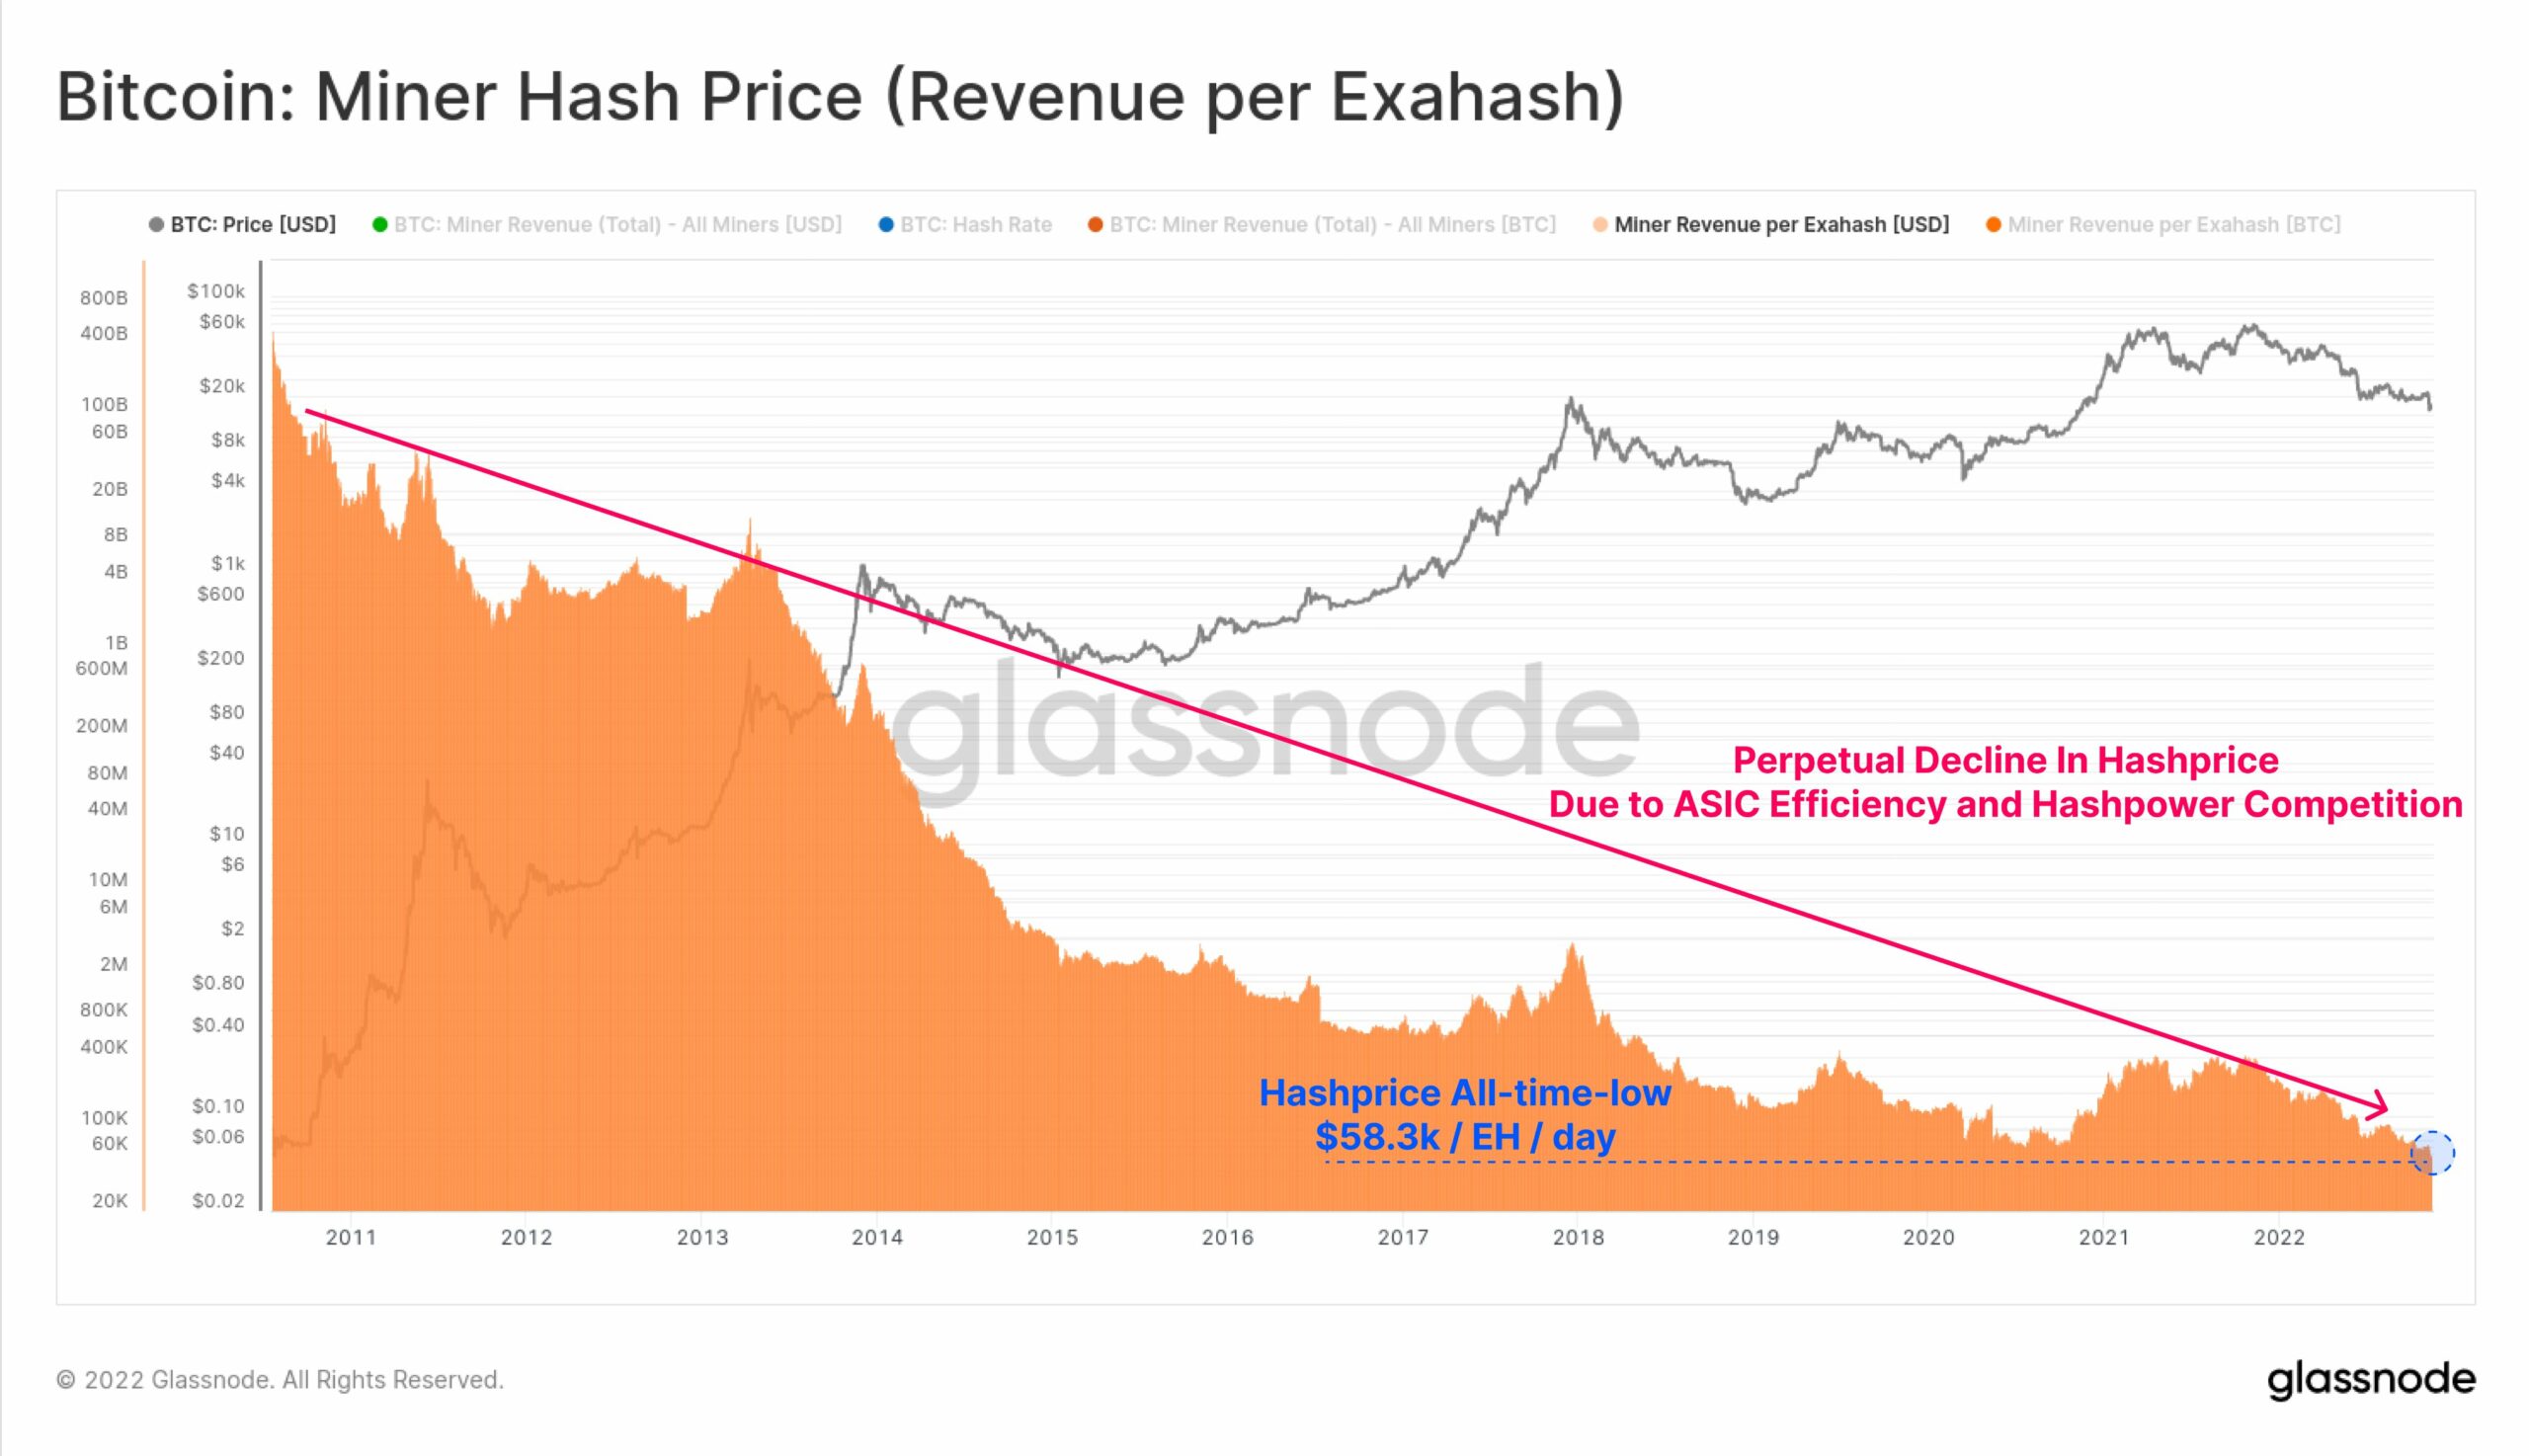
Bitcoin Miner Capitulation Causing Maximum Pain?
As Glassnode’s senior on-chain analyst Checkmate noted via Twitter, Bitcoin miners could be in for more pain as they have run into serious trouble in recent months.
The hashish price has fallen to an all-time low. The mining industry is fast becoming another problem area in the market, and thus the risk of “miner capitulation in round 2” also increases.