Selling from whales holding 1k+ BTC behind Crash
On-chain data shows that Bitcoin whales with more than 1k BTC were the main sellers in the latest crash, as other cohorts showed muted activity.
Bitcoin used output value band shows peak from 1k-10k group
As pointed out by an analyst in a CryptoQuant post, unlike the previous declines, the 10-100 BTC and 100-1k BTC cohorts did not show any spikes in activity during the latest crash.
The relevant indicator here is “Spent Output Value Bands” (SOVB). which shows the number of coins moved by each value band in the Bitcoin market.
These “value bands” or groups are divided based on the amount of coins moved in each transaction on the chain. For example, the 1k-10k BTC value band includes all transfers that involved between 1k and 10k BTC.
The spent output calculation for this value band then specifically measures the total amount of Bitcoin that was shifted using transactions of size that fall within this range.
Now, here is a chart showing the trend of Bitcoin SOVB for 10-100 BTC:
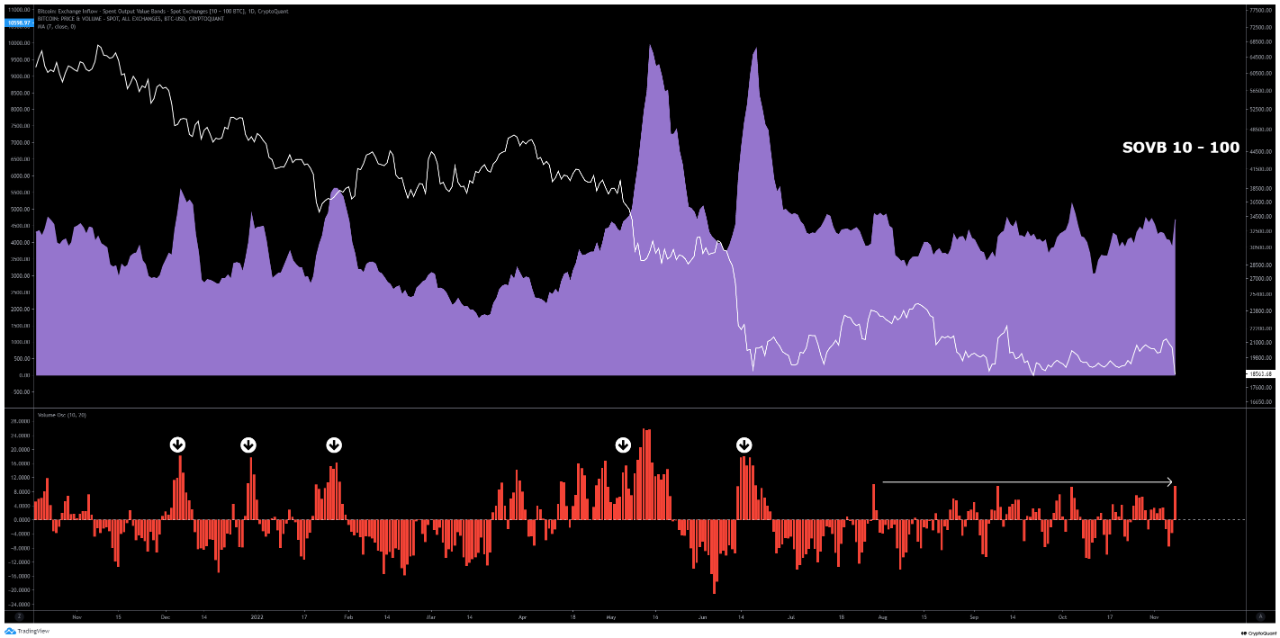
The value of the metric seems to have been normal recently | Source: CryptoQuant
As you can see in the graph above, the Bitcoin Spent Output chart for the 10-100 BTC value band rose during the previous sell-offs, suggesting that investors with at least 10 to 100 BTC sold their coins a lot.
A similar trend was also seen for the 100-1k BTC value band, as the chart below shows.
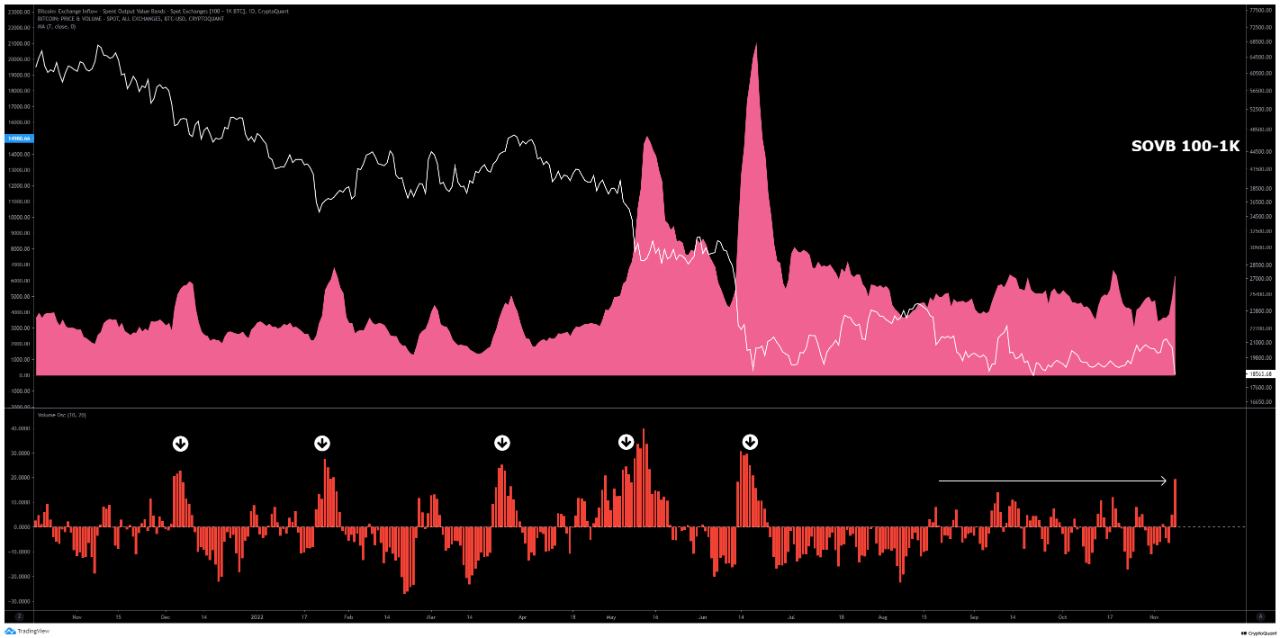
Looks like this metric has also not significantly gone up in recent days | Source: CryptoQuant
In the latest crash, however, while there was a peak in these indicators, it was not nearly as sharp as in the previous cases. This suggests that these value bands are not so much dumping this time.
However, the 1k-10k BTC cohort has shown a different behavior. Below is the graph of used output for this value band.
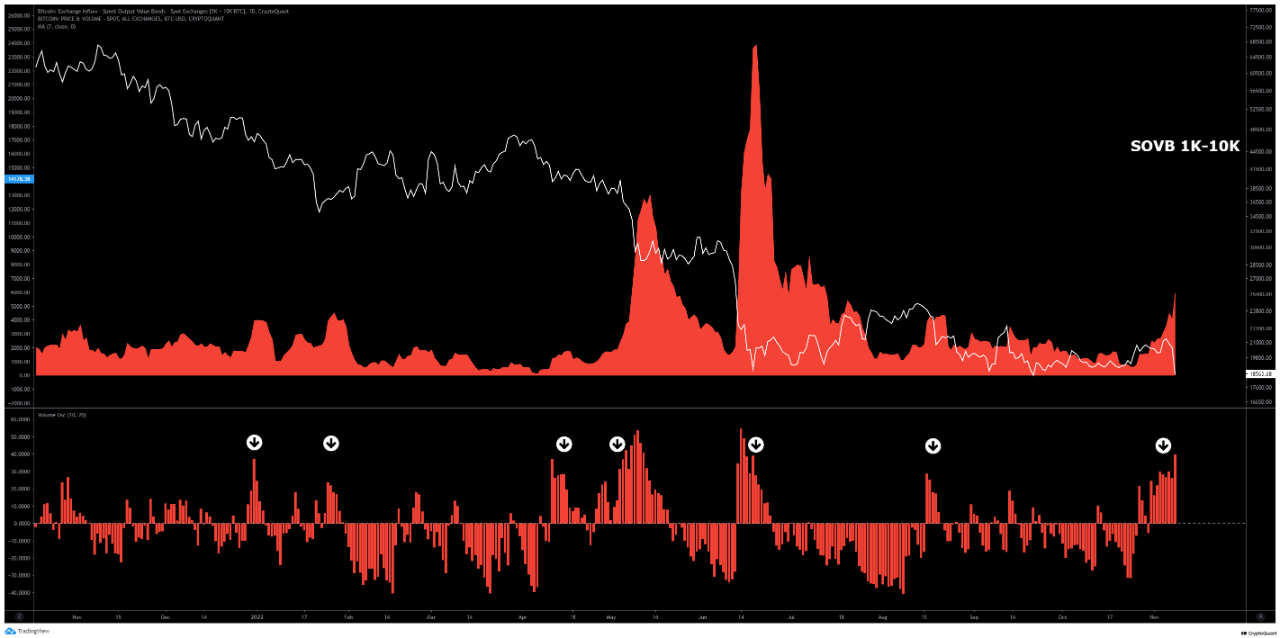
The indicator has shot up | Source: CryptoQuant
As can be seen from the chart, the 1k-10k BTC value band saw a big move in the crash, suggesting that transactions worth more than 1k BTC accounted for the majority of sales this time around. Such large transfers belong to the whales, which means that the whales drove this crash.
While whale dumping is negative for the market, the quant notes that the decline in the other two cohorts could be a sign that the selling pressure is now almost exhausted in the Bitcoin market.
BTC price
At the time of writing, Bitcoin’s price is hovering around $17.1k, down 15% in the last week.

BTC plummets down | Source: BTCUSD on TradingView
Featured image from Georg Wolf on Unsplash.com, charts from TradingView.com, CryptoQuant.com


