Quant points out striking similarity between 2017 and 2021 Bitcoin cycles
A quant has pointed out the similarities between the 2017 and 2021 Bitcoin cycles, which could hint at how the rest of this bear market might play out.
Both the 2017 and 2021 Bitcoin cycles saw new lows around the 365-day mark since the peak
As explained by an analyst in a CryptoQuant post, the two cycles are more similar than one might expect them to be.
The indicator of relevance here is the “drawdown from ATH”, which measures the percentage decline in the price of Bitcoin after the all-time high in each cycle.
Here is a chart showing the trend in this metric for the 2017 and 2021 cycles:
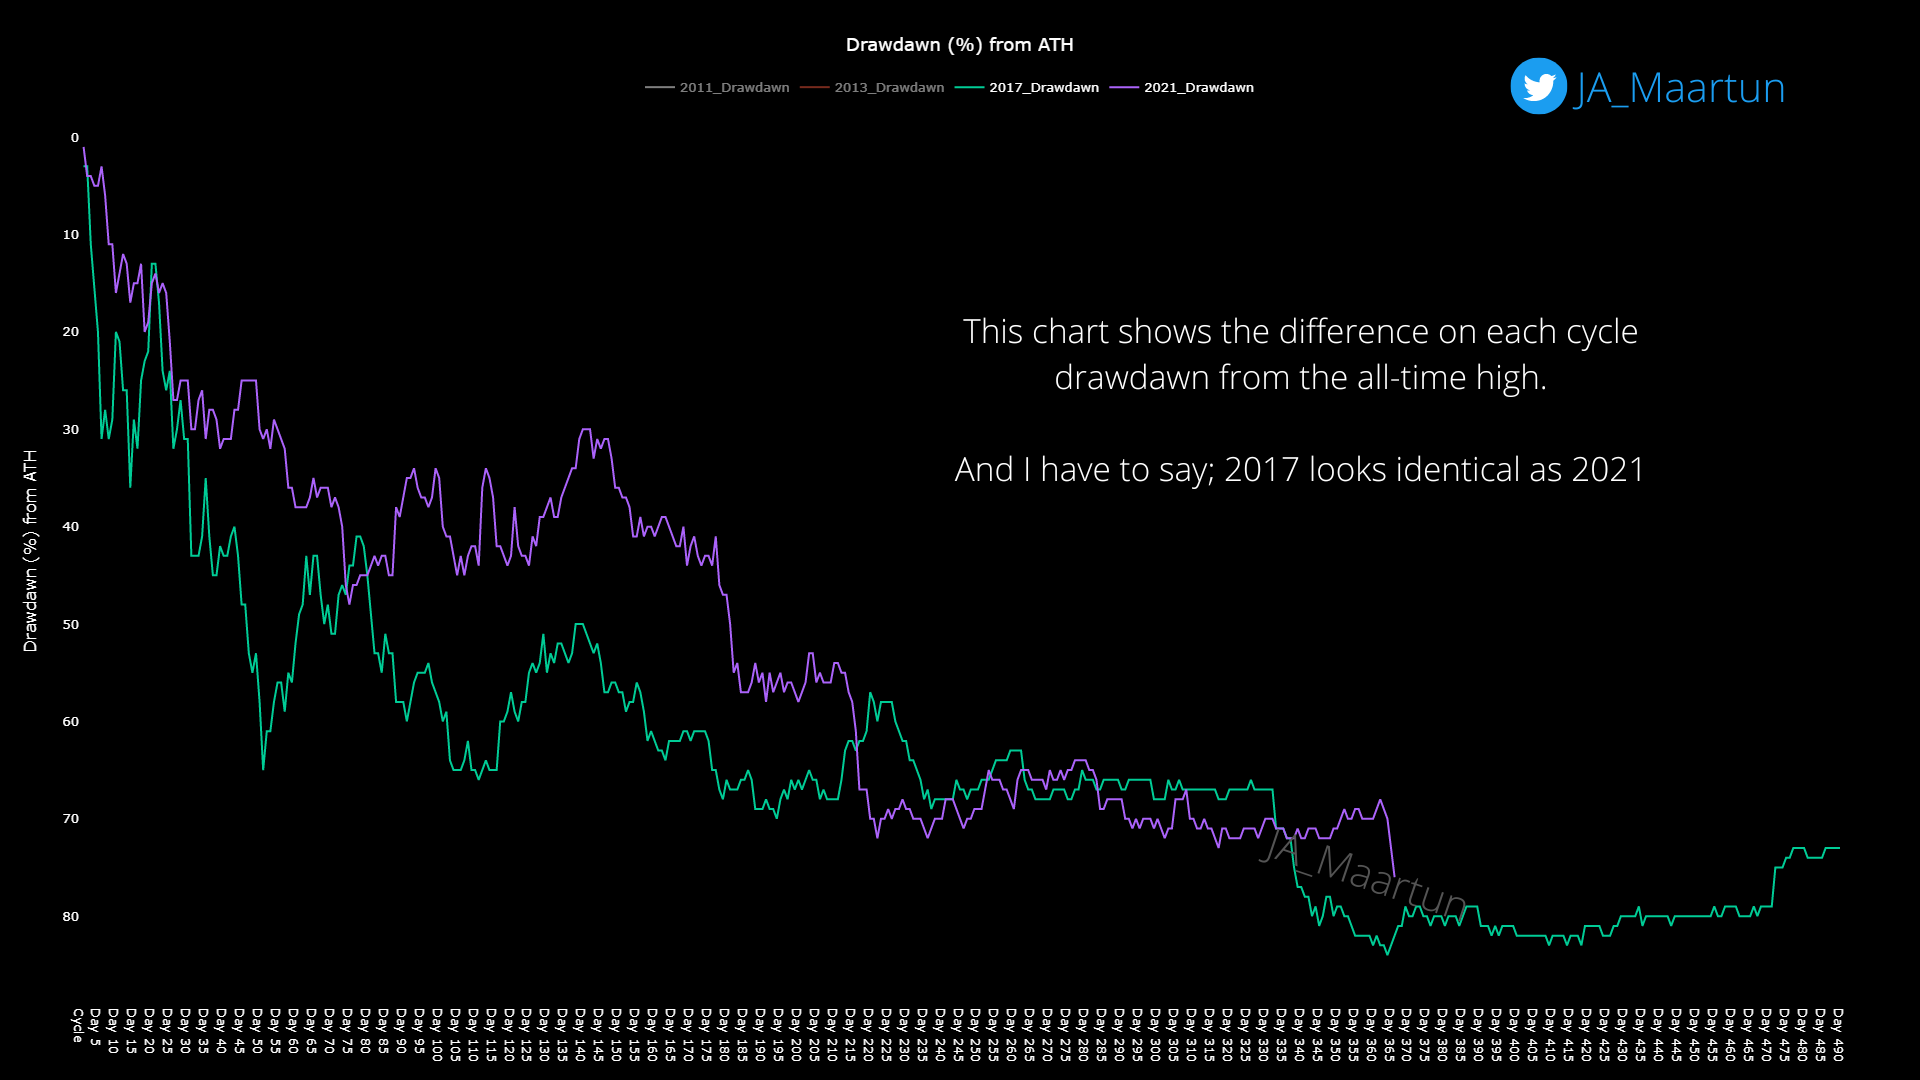
Looks like the current cycle hasn't gone as deep as the previous one yet | Source: CryptoQuant
In the graph above, the starting point for the 2017 Bitcoin cycle pullback is in December 2017, when the high for the period was set.
After this peak, the price of the crypto took a sharp hit until around when the drawdown from ATH had reached a value between 65-70%.
After reaching these drawdown values, the price started to stabilize, running sideways for about 110 days.
Then, in November 2018, however, the value of Bitcoin suddenly collapsed, and continued to decline until bottoming out around 365 days after the ATH.
As for the current 2021 cycle, the top formed last November and since then the price has been falling. The chart shows the path this drawdown has taken so far.
Although the decline is not exactly the same in the two cycles, there is still a striking similarity between them.
Just like in the previous cycle, Bitcoin plunged hard after the peak, until the drawdown from the ATH reached a value of 70%.
The crypto’s price then consolidated flat similar to the previous cycle, and then around the 365-day mark, BTC made another low after plunging in a similar fashion to the November 2018 crash.
So far, this cycle has been similar to the previous one, but it is currently uncertain whether it will continue to do so for the rest of the bear or not.
If indeed it follows a similar trend from here, then the quant believes there will still be another 100 days of sideways movement left (where the cycle bottom will form) before the end of the bear.
BTC price
At the time of writing, Bitcoin’s price is hovering around $16.5k, down 20% in the last week.

The value of the crypto seems to have been moving sideways recently | Source: BTCUSD on TradingView
Featured image from Jonathan Borba on Unsplash.com, charts from TradingView.com, CryptoQuant.com

