On-chain data shows that Bitcoin is emerging from the depths of despair
Early signs of a bull market
CryptoSlate’s previous report dives deep into the signals pointing to a Bitcoin bottom. Our analysis showed that despite the widespread macro uncertainty, most on-chain indicators point to a bottom forming.
However, identifying a bottom is only the first step in predicting future market movements. A strong bottom only shows the potential for a market rally – other indicators on the chain are needed to further confirm the end of the bear market.
In this report, we take a deep dive into the chains that show another bull market is currently developing.
The Bitcoin network is expanding
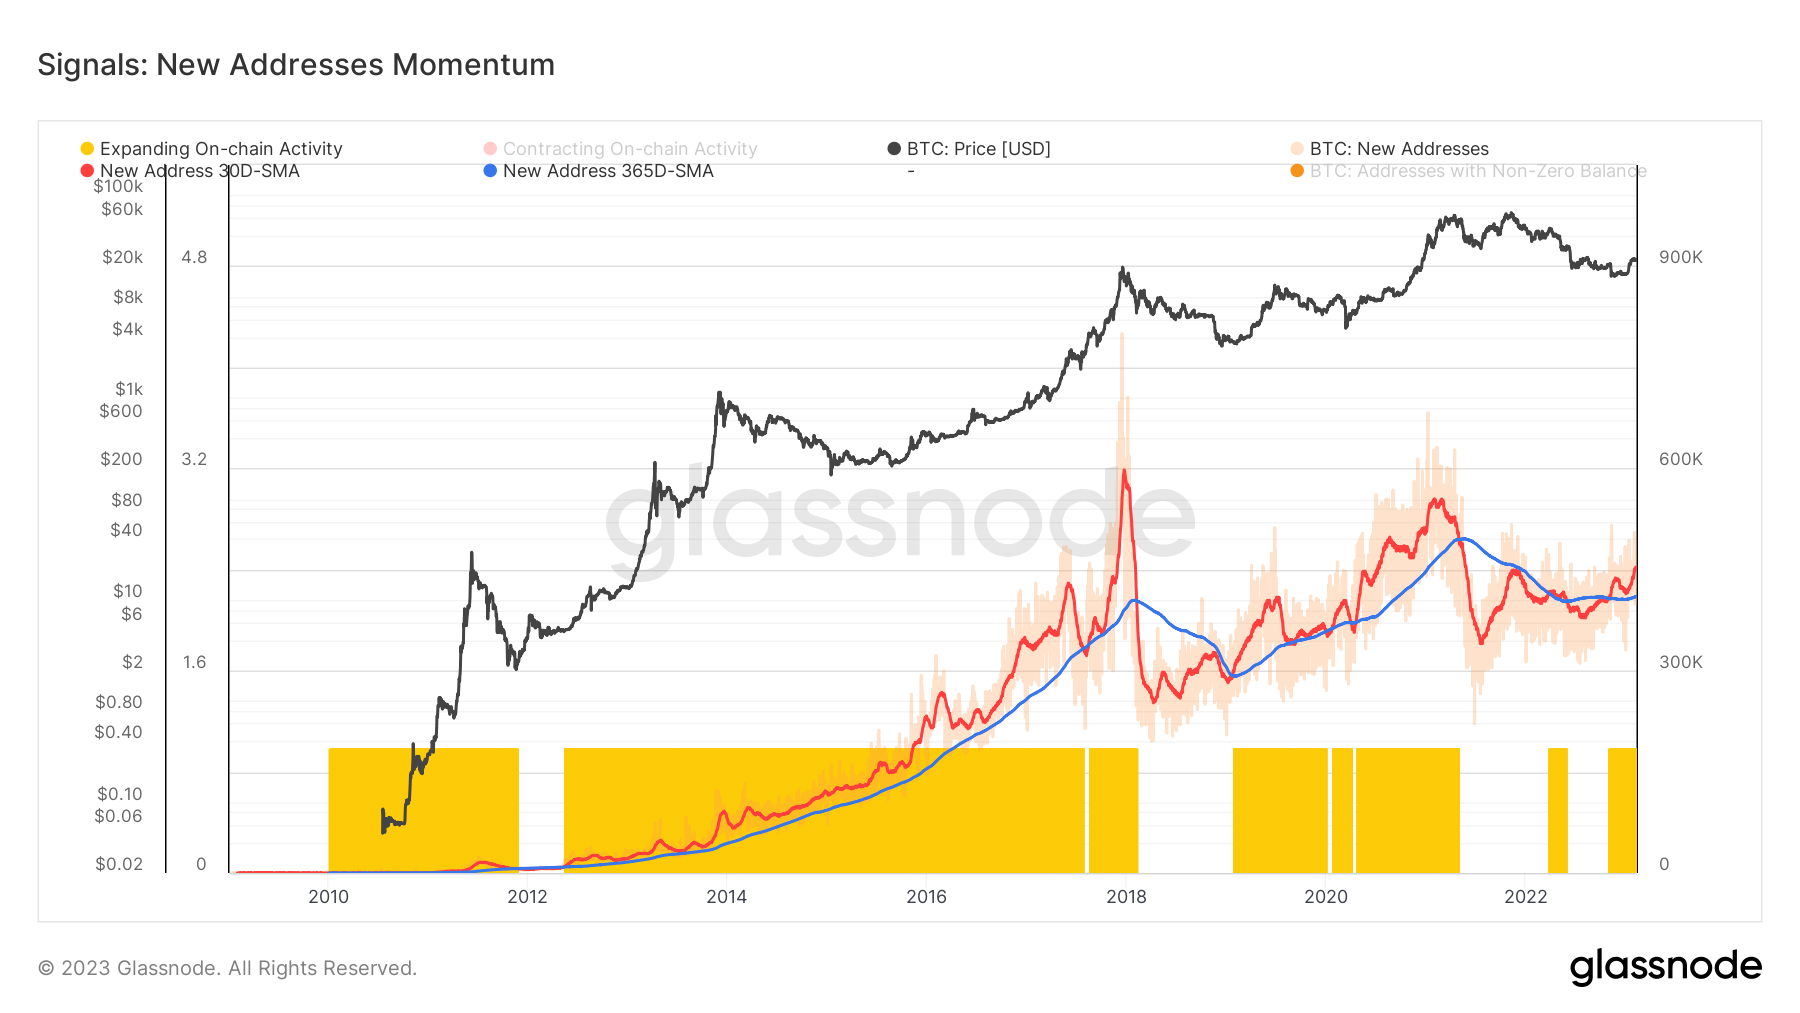
The number of users interacting with a network is one of the best indicators of its performance. Early bull markets of the past decade began with an increase in daily users, a higher transaction throughput and an increased demand for block space.
This can be seen when looking at the momentum of new addresses on the Bitcoin network. When the new address momentum’s 30-day simple moving average (SMA) crosses the 365-day SMA, the network enters an extension period. Simply put, the rate at which new addresses were created in the last 30 days is higher than the rate at which they were created in the last year.
Data analyzed by CryptoSlate shows that the Bitcoin network is seeing its fundamentals improve. The 30-day SMA has crossed the 365-day SMA, indicated in the graph below. Sustained periods of this trend have correlated with bull markets and led to a gradual increase in Bitcoin’s price.
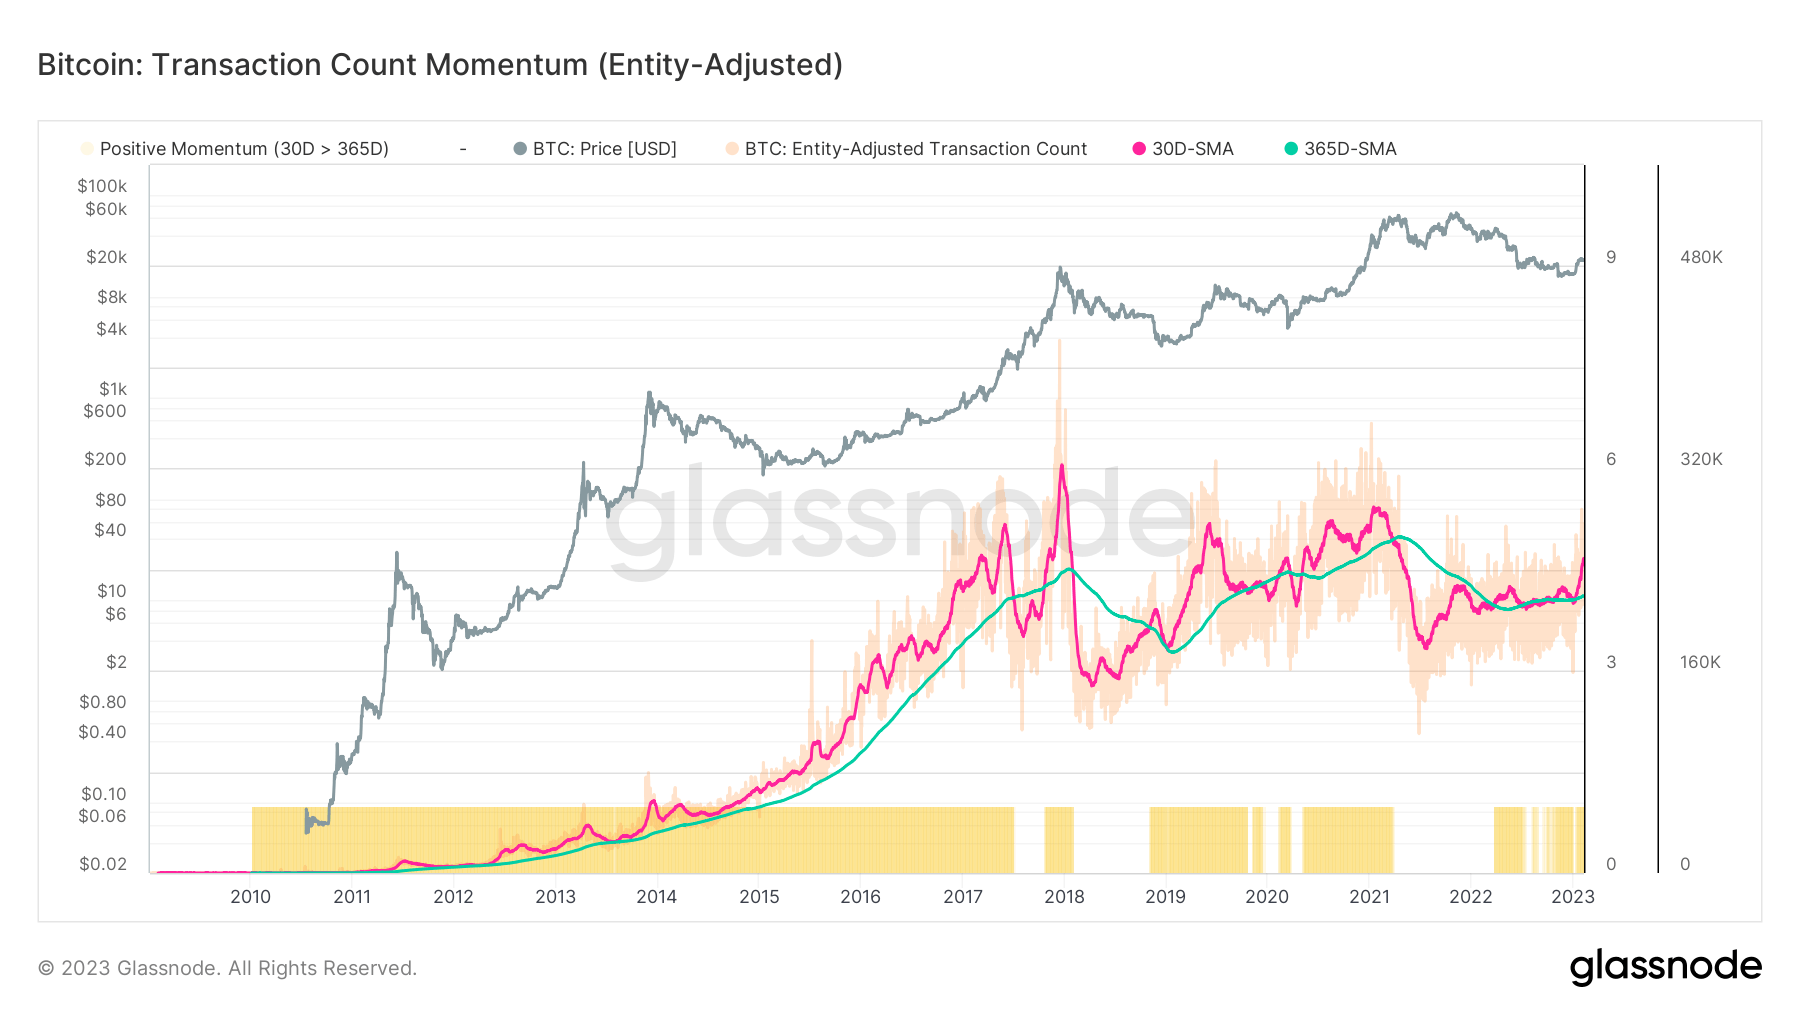
The same trend is also seen in the momentum of the number of transactions, where the 30-day SMA rose significantly since the beginning of the year, crossing the 365-day SMA.
The market is in profit for the first time since the collapse of LUNA
Both leading indicators of market earnings have been flashing green since the beginning of the year.
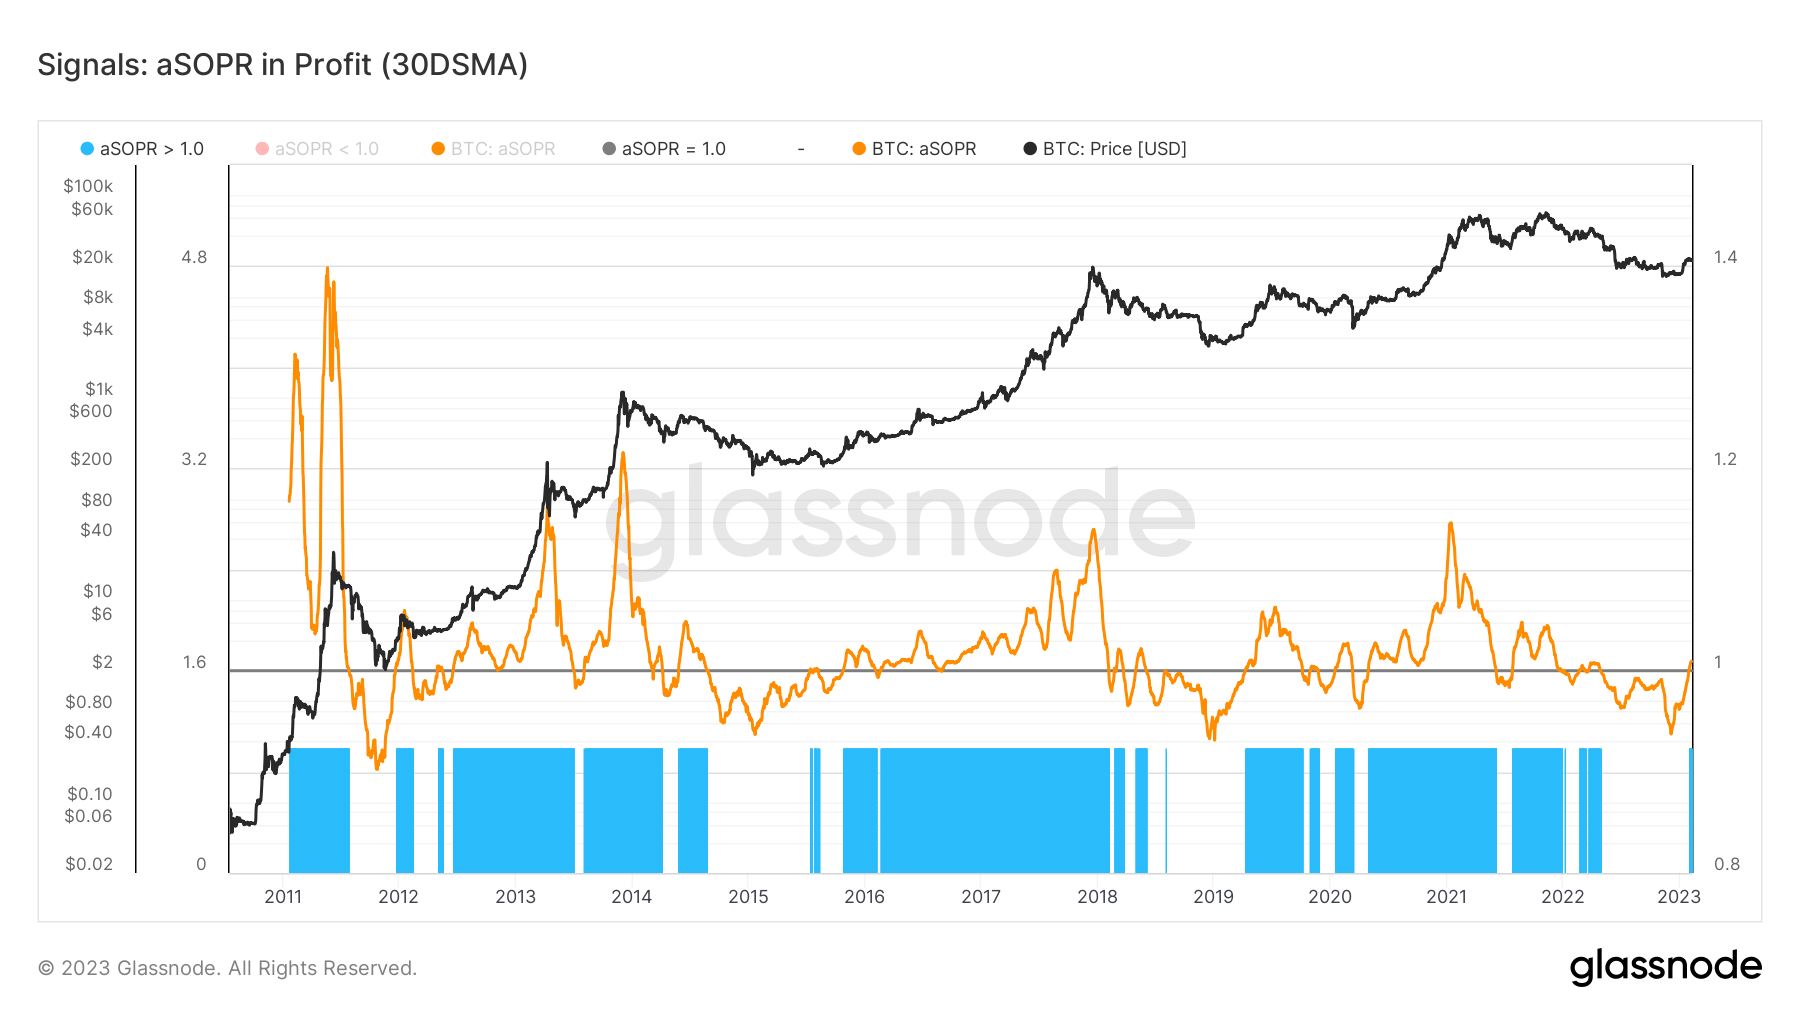
The Spent Output Profit Ratio (SOPR) is a metric that indicates whether the coins on the Bitcoin network are moving between wallets with an overall profit or loss. The calculation is a ratio of the value of Bitcoin UTXOs at creation to the value of Bitcoin UTXOs when they were spent.
And while SOPR assumes that all coins moving from one wallet to another were sold, it’s still a solid gauge of the profits that could potentially be on the network.
A SOPR score of 1 or higher indicates that the market has realized a profit. Historically, SOPR violations and holdings have indicated a healthy increase in demand for Bitcoin.
The last time SOPR stayed above one was in April 2022, just before Terra (LUNA) collapsed. However, the peak in April was a short-lived break in the overall downward trend in SOPR that began in November 2021. As indicated in the graph below, a similar downward spiral was seen every time Bitcoin broke its all-time high.
Nevertheless, the current SOPR score indicates market recovery. While there may be several dips below 1 before the market enters a true bull run, the current high is a positive sign.
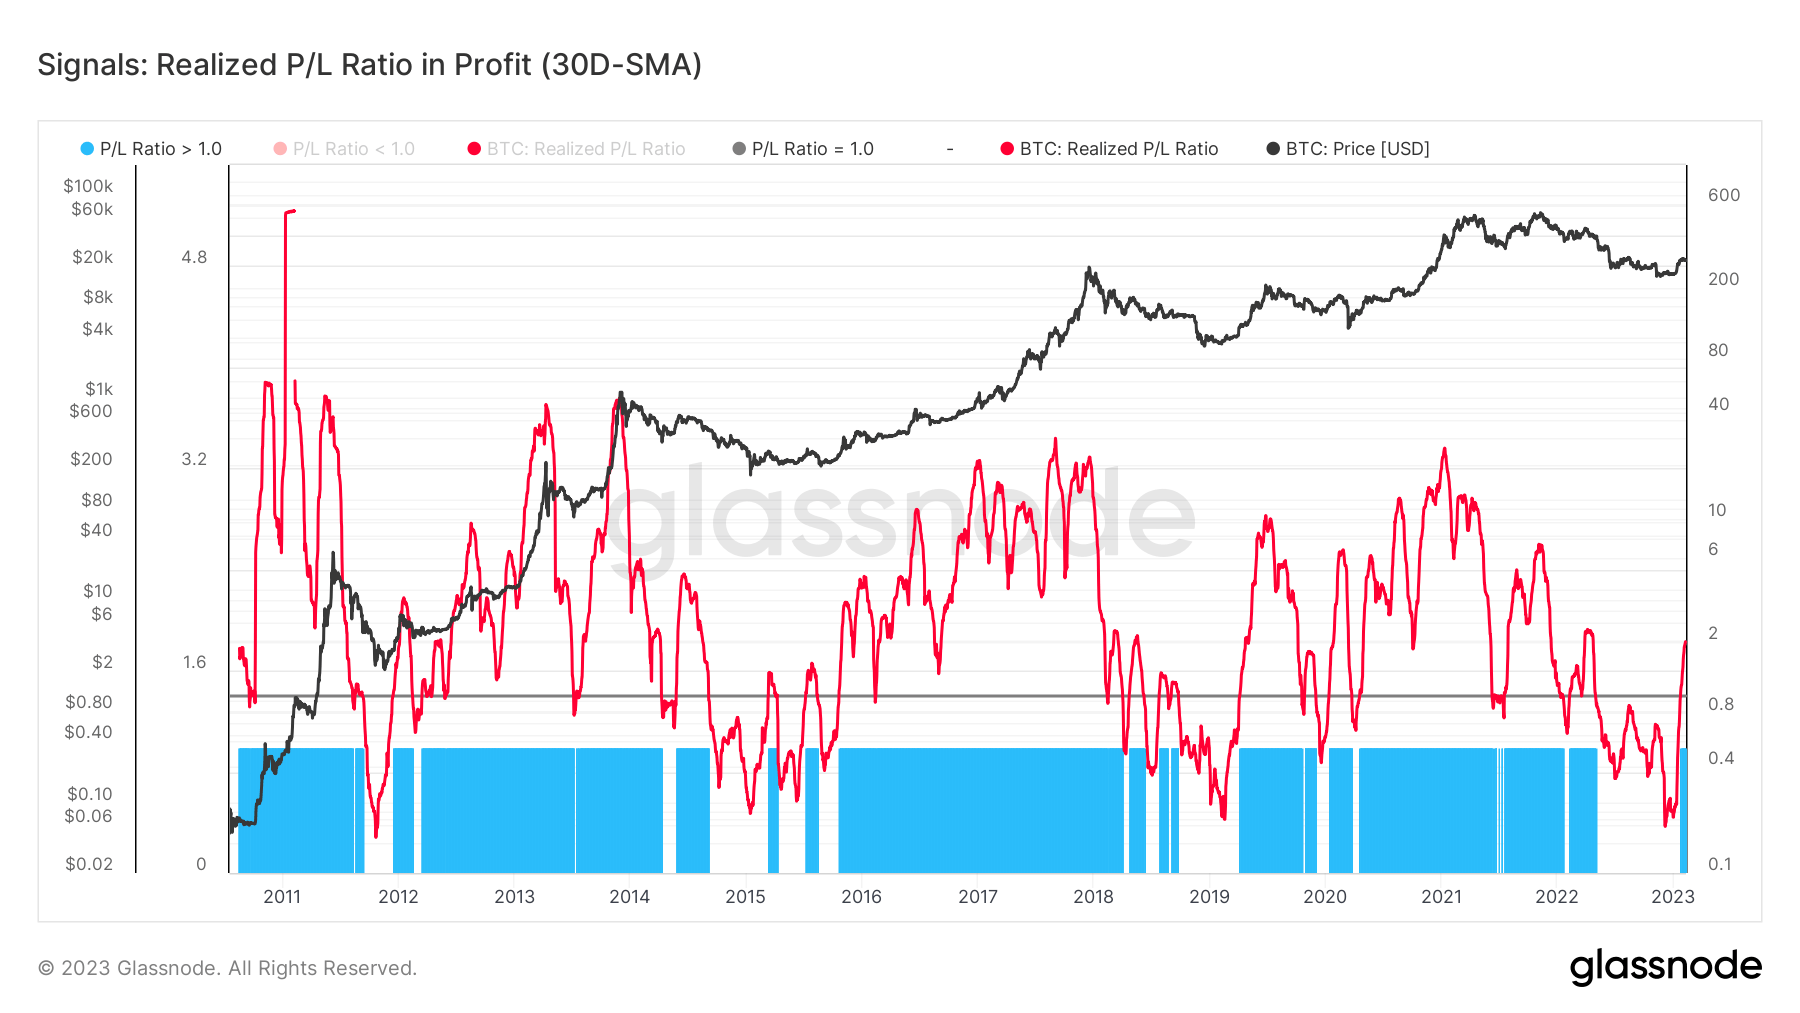
The trend SOPR suggests is further supported by the realized profit/loss ratio. The calculation represents the ratio of all coins moved with profit to loss and is another solid indicator of market health.
Like the SOPR, a P/L ratio higher than one indicates a greater share of USD-denominated profits than losses on the network. Data analyzed by CryptoSlate showed a P/L ratio of 2, which shows that sellers with unrealized losses are exhausted and there is a healthy influx of demand for Bitcoin.
It is important to note that a P/L ratio is highly volatile and can be tested several times in an early bull market. The sharp rise in 2023 could serve as resistance and support in the coming months.
Miner income from fees increases
The expansion of the Bitcoin network is followed by an increase in demand for Bitcoin block space. The network’s high number of transactions in the last three months has led to a noticeable increase in fee income for Bitcoin miners.
This can be seen in the fee income Z-score, which shows the number of standard deviations above or below the average fee income. During bull markets, Z scores are higher than 0, indicating an increased demand for block space, leading to higher fees. Higher fees paid by users lead to increased fee income for miners. Bear markets are seeing a decline in demand for block space, leading to a drop in fee income. The graph below marks positive Z-scores in red and negative Z-scores in blue.
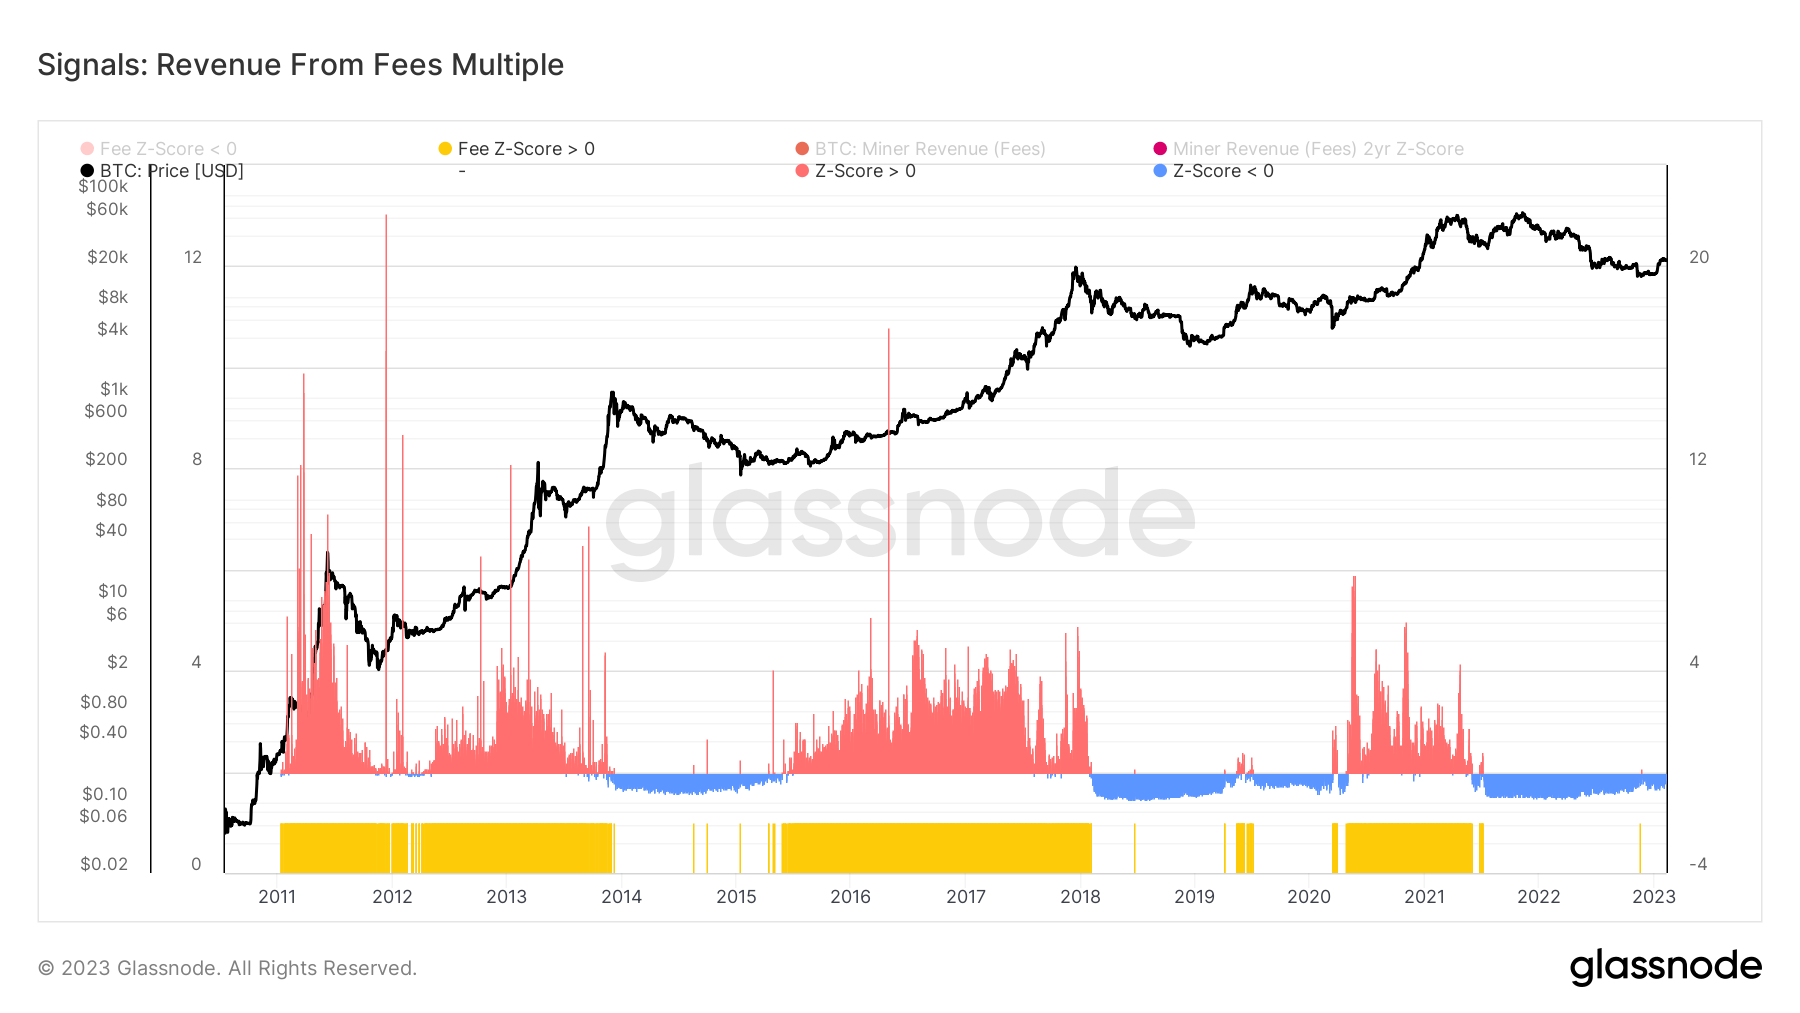
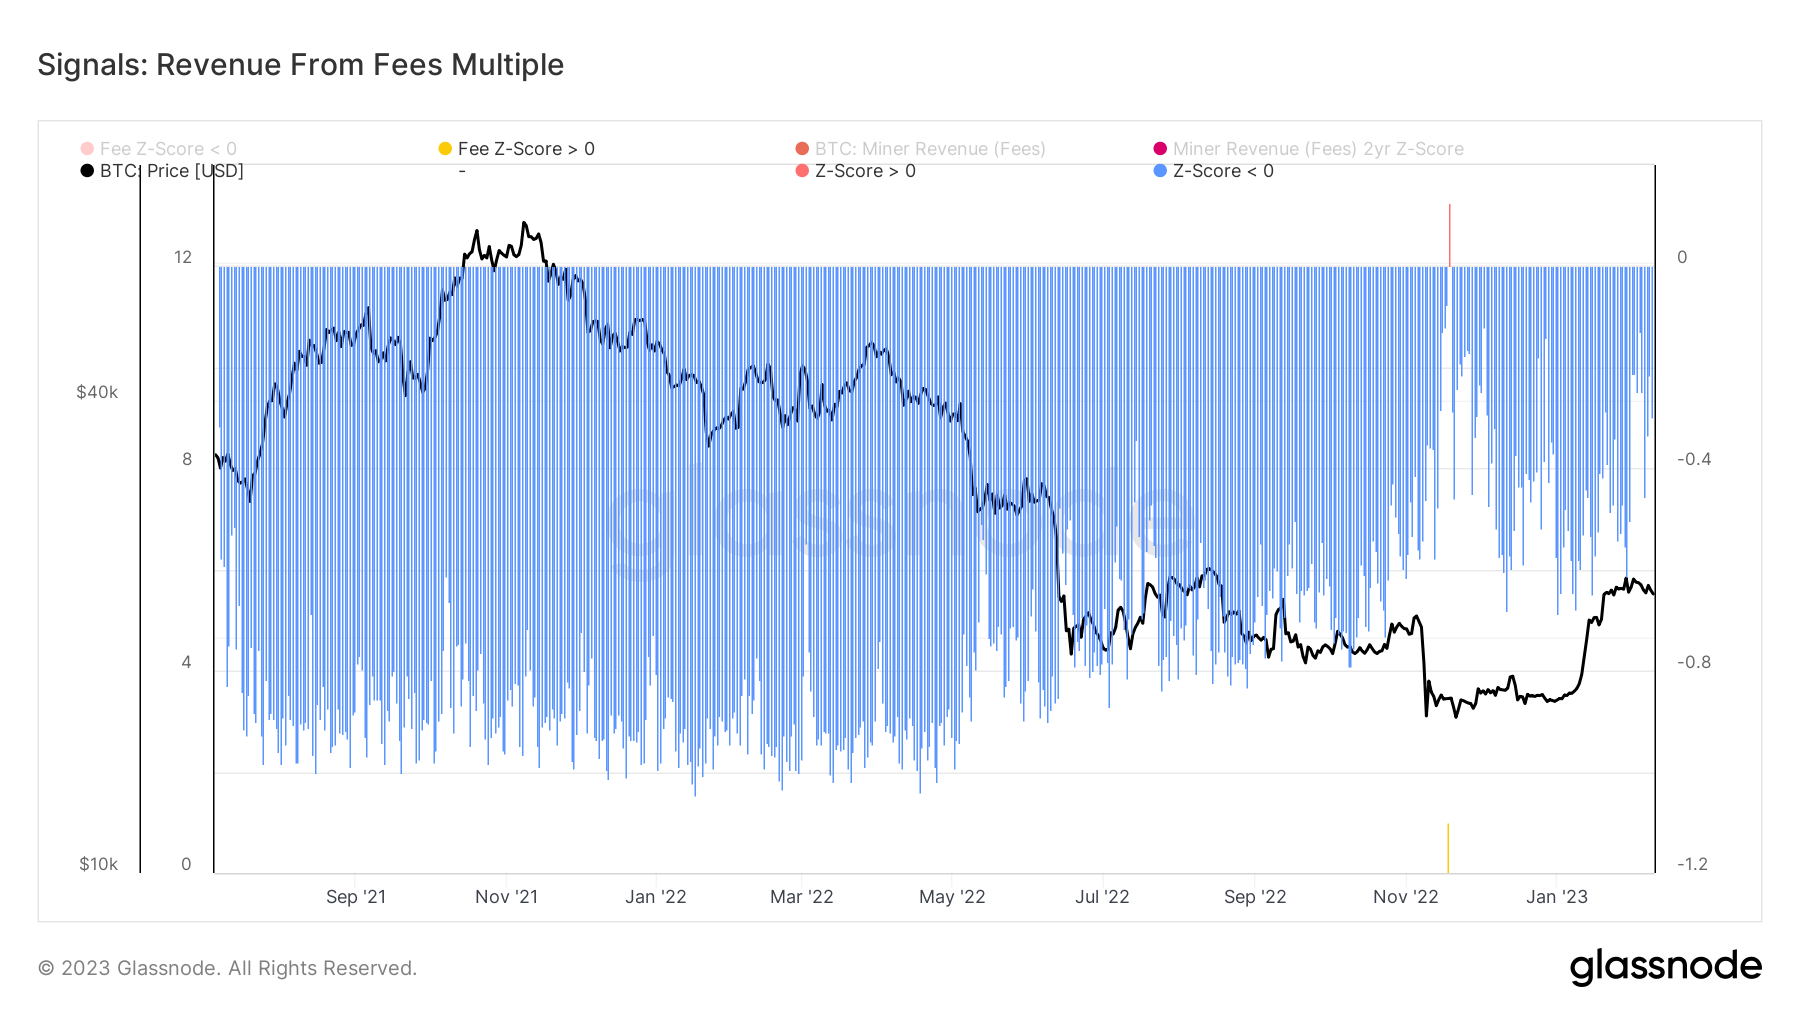
The spike in Z-score seen in November 2022 shows that the FTX collapse caused an unprecedented demand for block space. And while some of this demand can be attributed to aggressive accumulation, most of it came from panic selling.
Diving deeper into the Z-score confirms previous findings that the bull market stopped in mid-2021. The second half of 2021 saw a massive decline in demand for block space, evident in a continuously low Z-score.
However, 2023 brought a new appetite for block space. There has been a slow but steady increase in Z-scores, peaking in late January with the launch of Bitcoin Ordinals. There has been a clear increase in Z-scores in February, which may continue throughout the quarter as the number of transactions grows.
Technical pricing models have reversed
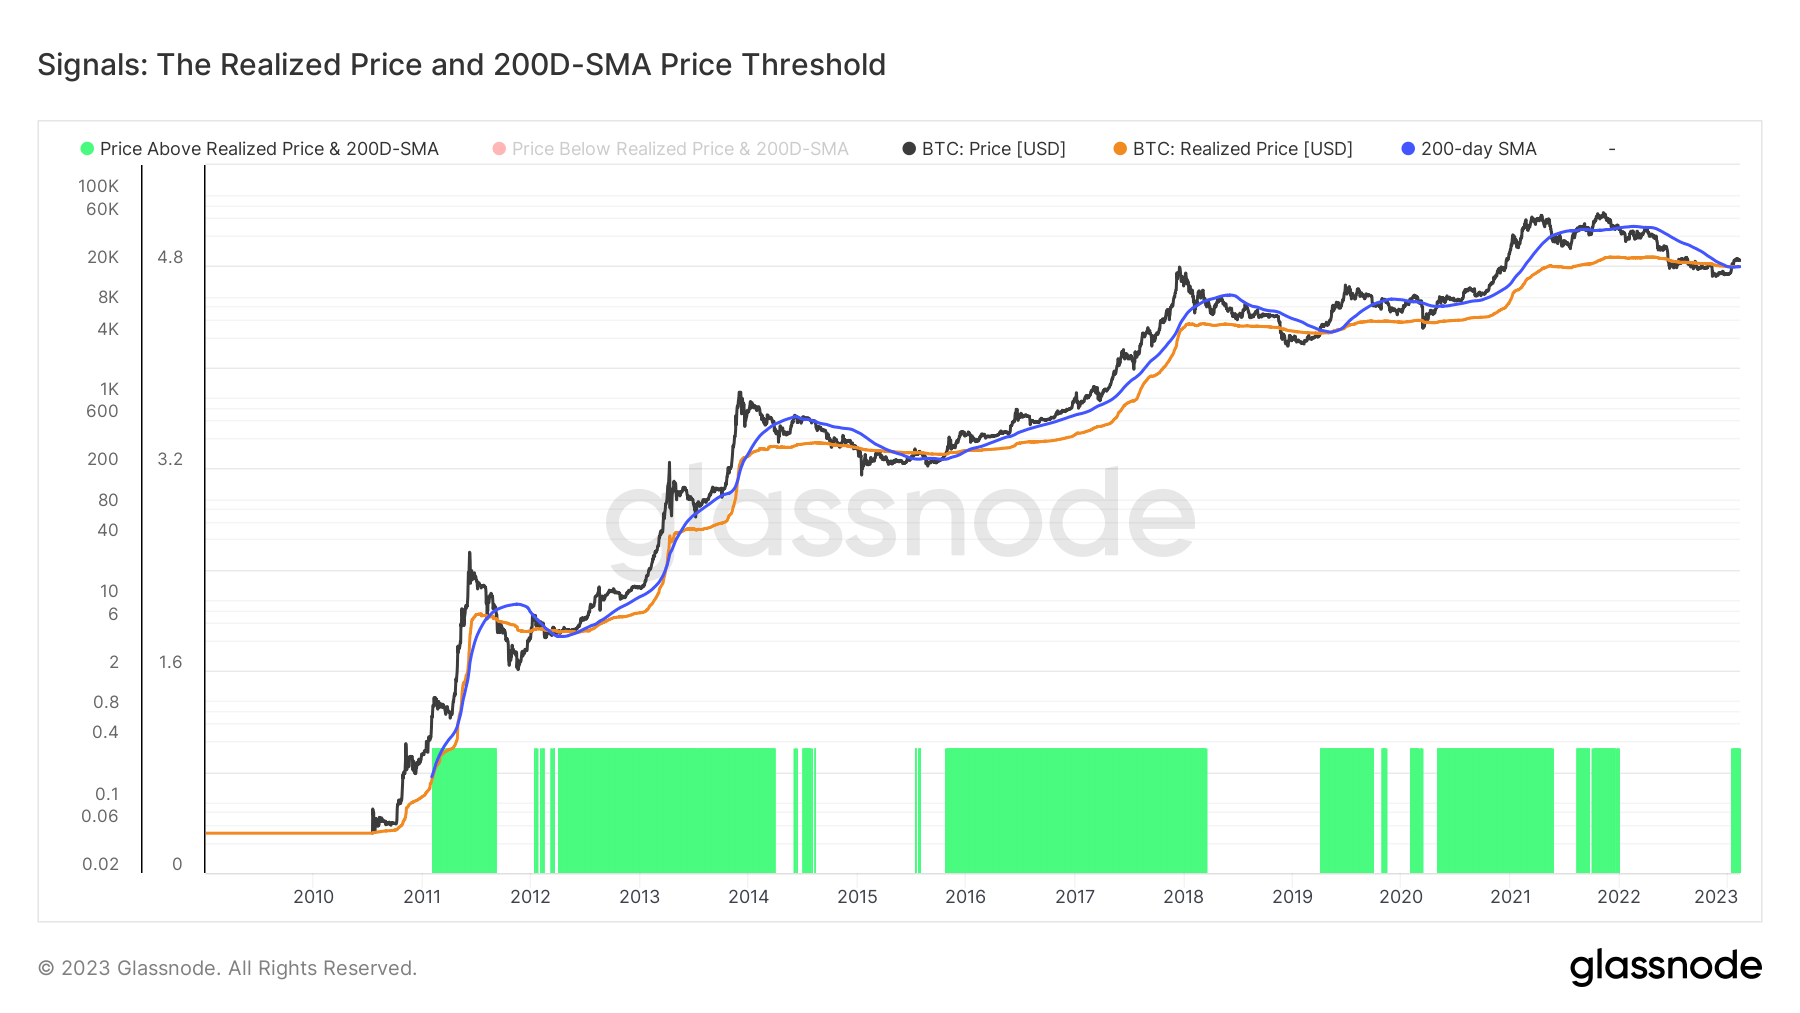
As covered in previous CryptoSlate market reports, Bitcoin has spent the last three months breaking through several resistance levels, most notably the short-term holder cost basis and realized price.
Since the beginning of the year, Bitcoin’s price has broken above the realized price and the 200-day SMA. The 200-day SMA is a significant indicator of Bitcoin’s price movements, as breaks above it indicate the beginning of a bullish trend.
Realized price is also a solid yardstick for the value held in the market. Trading above realized price allows us to identify overall profitability and recognize unrealized profit.
The last time this happened was in December 2021, but the trend was short-lived. Before that, a break above the realized price and 200-day SMA occurred around April 2020 and triggered a bull run that lasted until the end of 2021.
With Bitcoin currently trading above both indicators, the market may be preparing for a bullish reversal. The burst of unrealized profits, missing from the winter bear run, could bring a new wave of demand to the market, pushing up Bitcoin’s price.
Conclusion
The increase in the number of addresses and transactions is a clear indicator of increasing network activity.
This increase in network activity has increased the demand for block space, increased the cost of transactions, and increased miner income from fees.
In turn, a healthier, more active network attracts even more new users, which creates further demand and results in significant buying pressure.
When combined with other technical price patterns, such as SOPR and the P/L ratio, these trends suggest that Bitcoin is emerging from a late-stage bear market and may be preparing for a bull run.
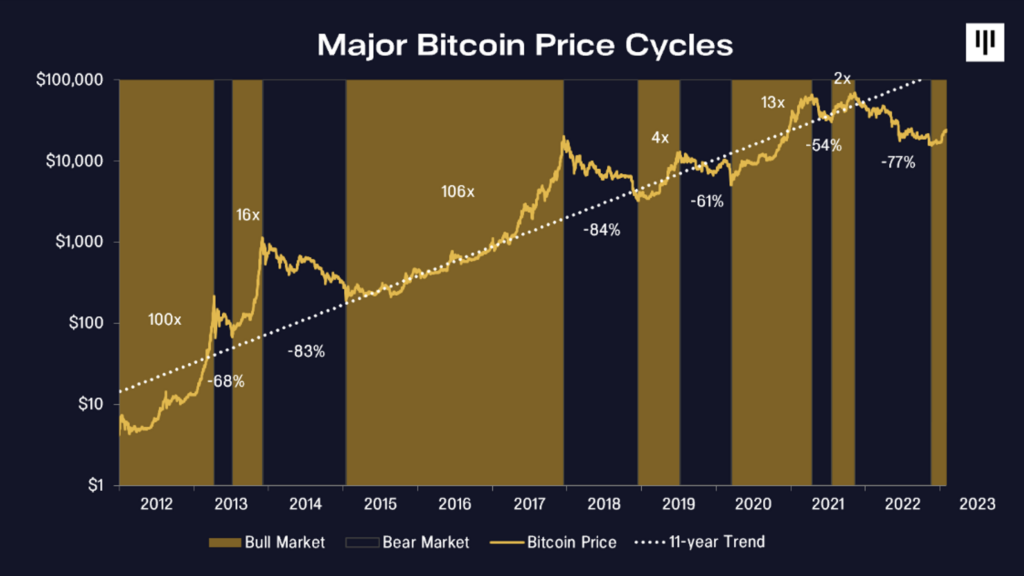
Pantera Capital, one of the largest VCs in the crypto space, also seems to have identified this trend, noting in its latest report that a seventh bull market cycle has begun.