Is Bitcoin Repeating This Late 2019 Price Pattern? See this one


Bitcoin cryptocurrency search concept with magnifying glass on yellow background. Close-up.
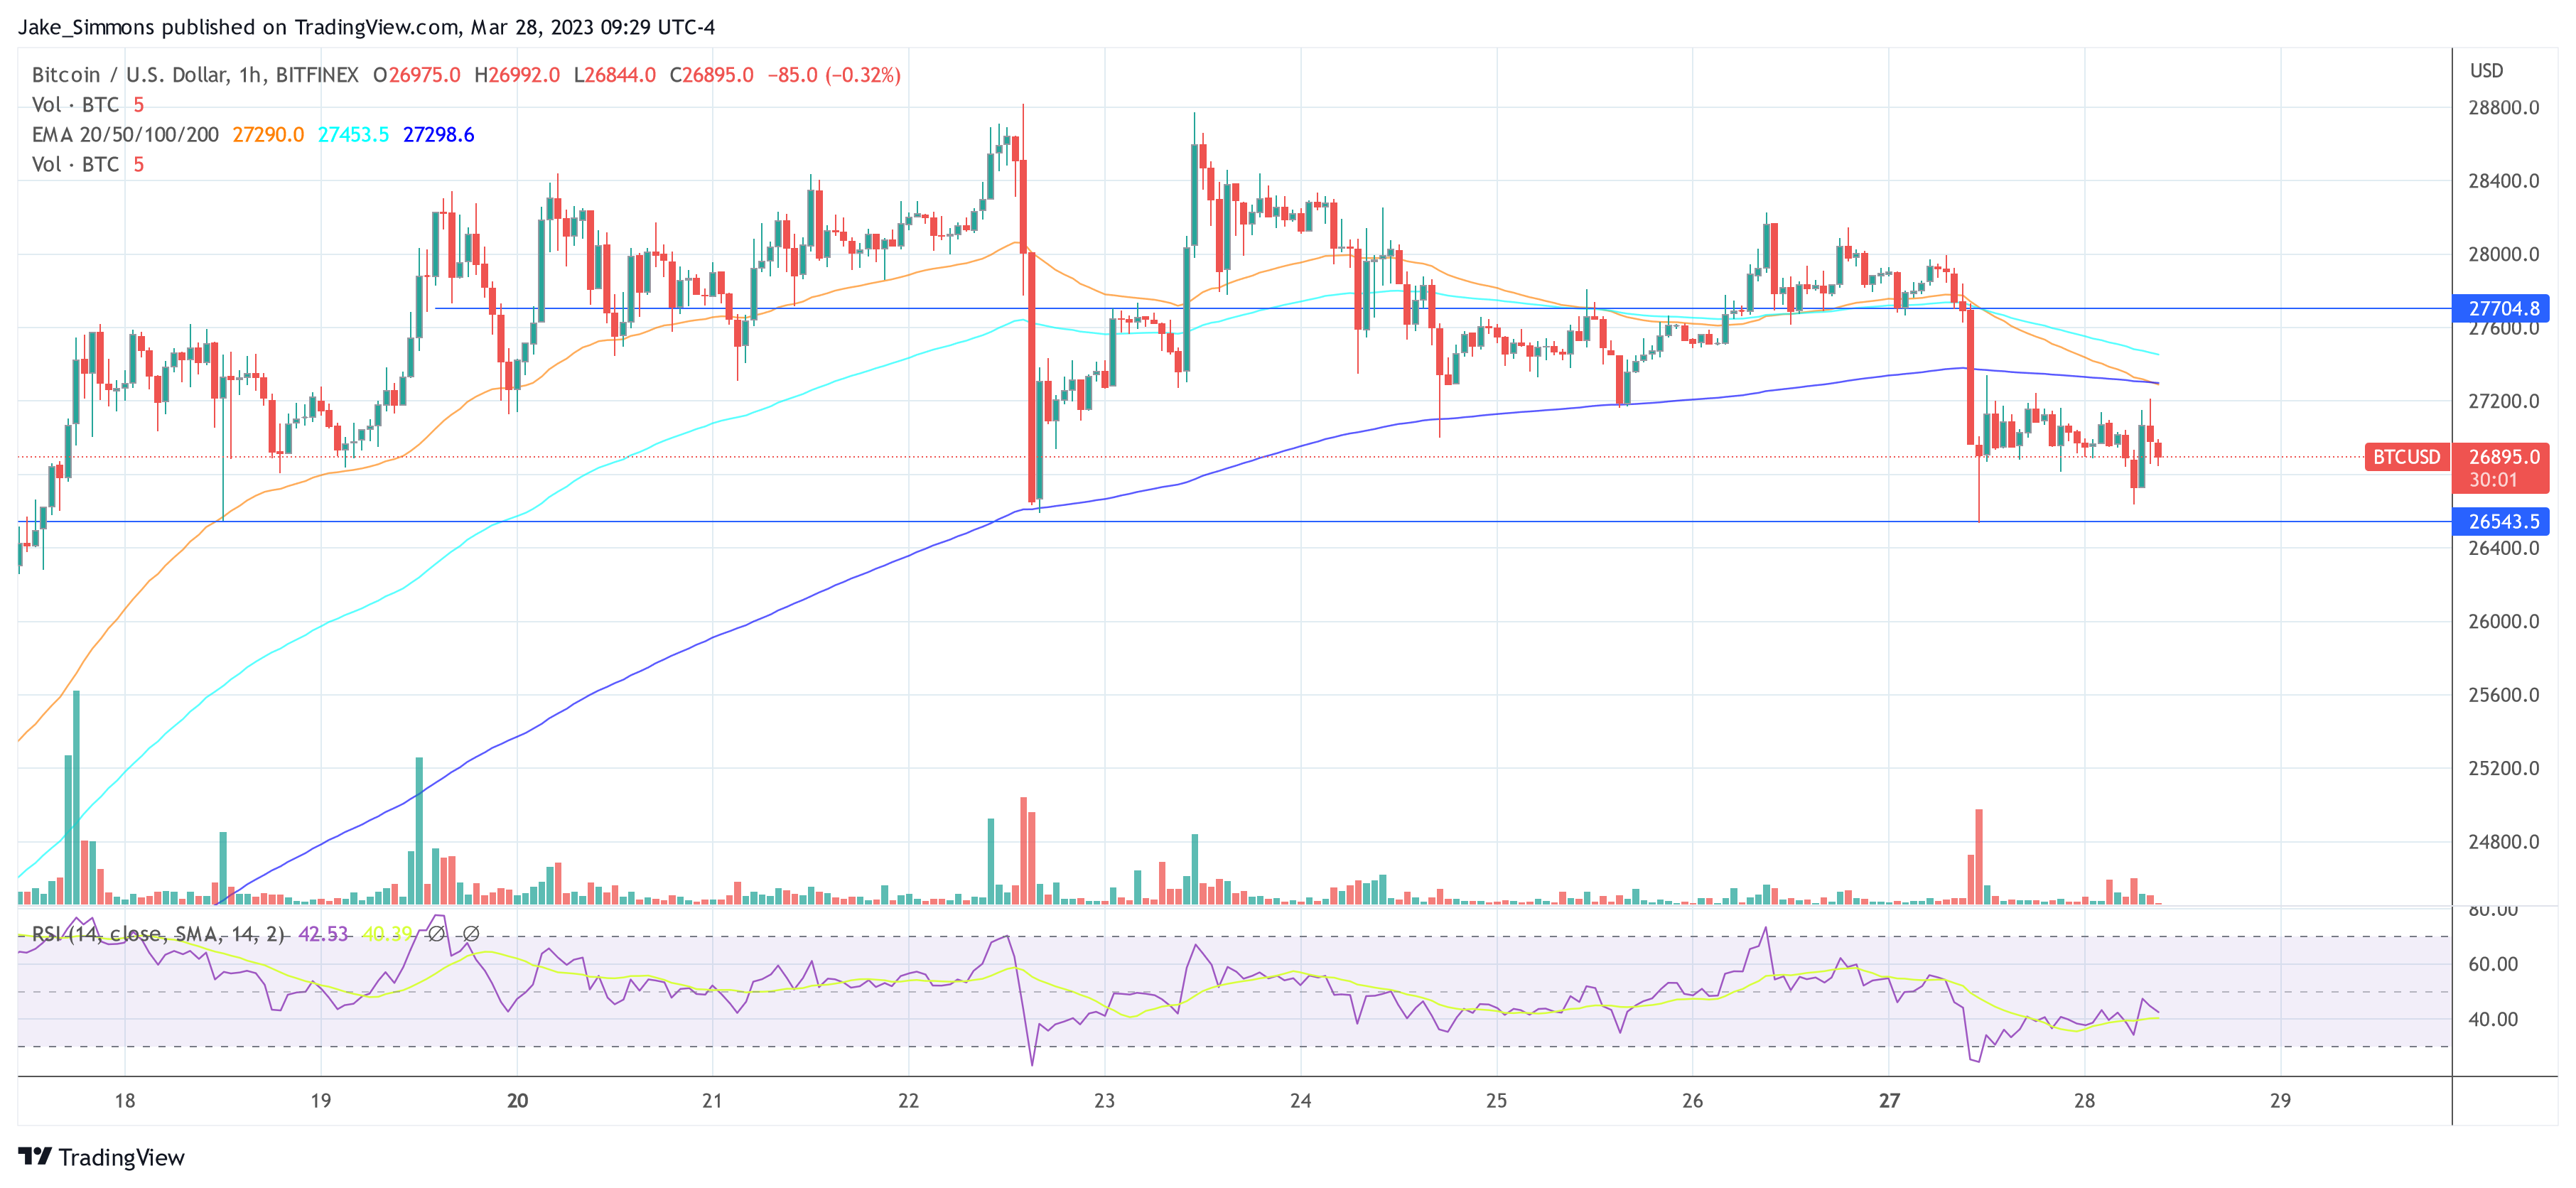
As a result of the lawsuit filed by the Commodity Futures Trading Commission (CFTC) against the world’s largest crypto exchange Binance, the Bitcoin market is currently experiencing a high degree of uncertainty. After yesterday’s 5% crash in one hour, the BTC price is currently struggling to get past the $27,000 mark, but Bitcoin is up 63% year to date.
BTC Repeat Price Action in Late 2019?
Analyst @tedtalksmacro looking many parallels in the current price trend and macroeconomic environment to the period from September to November 2019, when the Bitcoin price consolidated between $10,500 and $6,500. “Just like every other Bitcoin cycle, the current one has its nuances,” notes Ted, who sees the first similarity in the US Federal Reserve’s (Fed) interest rate policy.
In 2019, the Fed made three interest rate cuts by October. It also began expanding its balance sheet in September. The scenario is somewhat similar to today’s.
Currently, the Fed has already begun its balance sheet expansion—according to the prevailing view of experts—with its Bank Term Funding Program (BTFP) and extended swaps with five other central banks. Although the Fed’s dot plot does not include any rate cuts in 2023, the market is calling it a bluff and is pricing in a 100 basis point rate cut by the end of the year.
Bitcoin price trends are also similar. In 2019, the price had bottomed after moving 83% away from the all-time high (ATH). This was around 500 days before the next halving in 2020.
In 2023, the price bottomed after declining 78% from ATH. Like clockwork, the BTC price found its bottom again around 500 days before the halving in 2024.
“Consistency between cycles are new ATHs, echo bubbles, bear markets and consolidation phases; each time those phases play out a little differently for reasons other than price,” explained Ted, who shared the chart below.

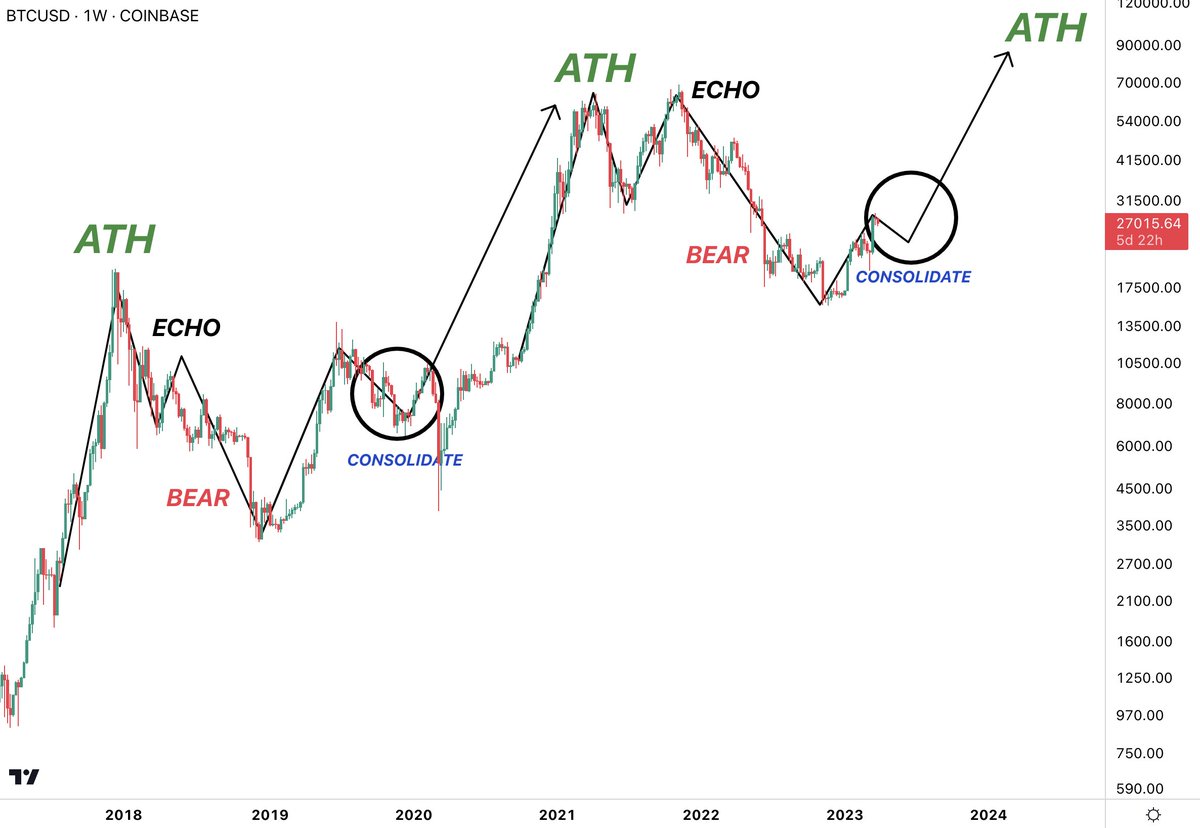
Furthermore, the analyst notes on the chart that the 2021/22 echo bubble was more intense due to the FTX collapse and therefore outperformed the 2018 echo bubble by a multiple. In addition, Ted speculates that the price of the covid swan should not repeat this cycle unless another black swan, such as a third world war, occurs. In conclusion, he says:
If you bet on new lows from here, it becomes clear that you are betting that this time will be different (I’ll never say absolutes, but betting against history usually doesn’t work well).
Similarities to 2020s Bitcoin FUD
Renowned analyst Andrew Kang has a similar view. In a recent tweet, he drew attention to the current similarities to the year 2020. The year 2020 was marked by a number of regulatory FUD stories surrounding Bitcoin.
In October 2020, the CFTC opened its case against BitMEX and its founders. A short time later, the Chinese government attacked OkEX and Huobi. After a rapid recovery, markets faced a burden of regulatory R&D from US and Chinese regulators, as Kang notes.

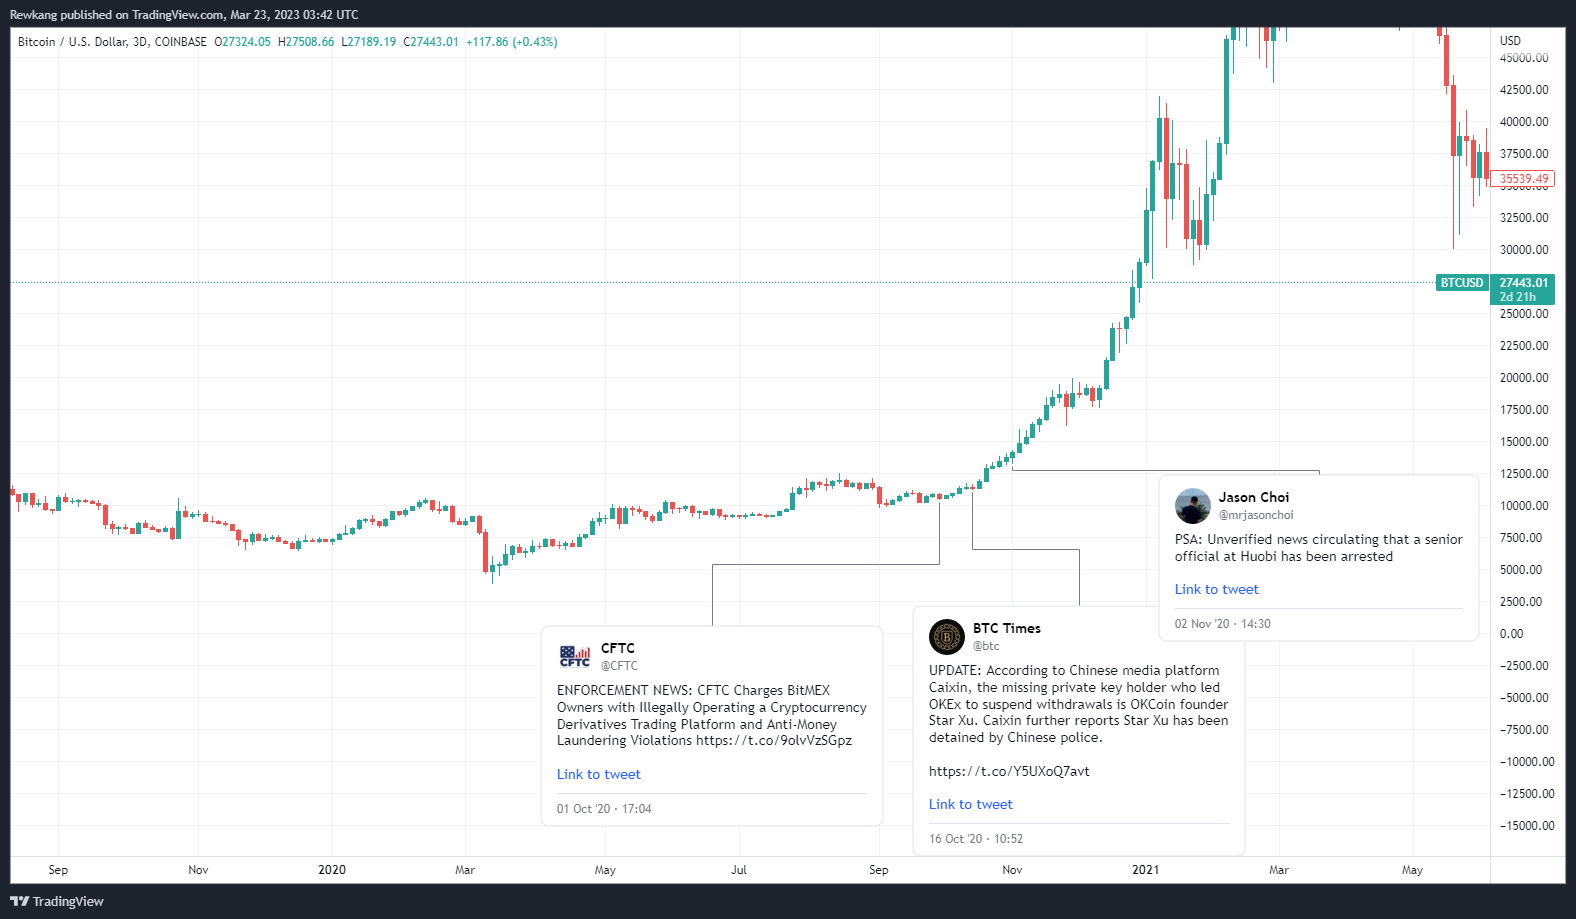
The US government went after Arthur Hayes and Bitmex. The Chinese government went after OKX and Huobi executives. The markets could not break below $10,000 and climbed the wall of concern. “Markets could not break below $10k and climbed the wall of concern,” says Kang, who also recently wrote:
Global crisis, markets panicked, months of long positioning washed out, only truly convicted holders remain, sellers in disbelief and traders ready to fade all rallies. Same playbook, just 3 years later.
At press time, the Bitcoin price was at $26,895, still struggling to shrug off the Binance news.

Featured image from iStock, chart from TradingView.com


