How Low Can Bitcoin Price Go?

Flagship digital asset Bitcoin (BTC) has had a rough year, falling 72% from its all-time high and losing more than 50% of its value this year alone.
On several occasions, the asset has seen its value plunge below the $20,000 mark. During the bear run, BTC fell below a previous cycle’s all-time high price – $19,750 – for the first time in its history.
These scenarios have led to the emergence of one of the most prevalent questions in the market “how low can BTC go?”
Firstly, there is no sure way to determine this as the volatile nature of the crypto market can be highly unpredictable – one only needs to look at how Ethereum’s (ETH) price performed after the highly anticipated merger to get an idea of how unpredictable the market is is. .
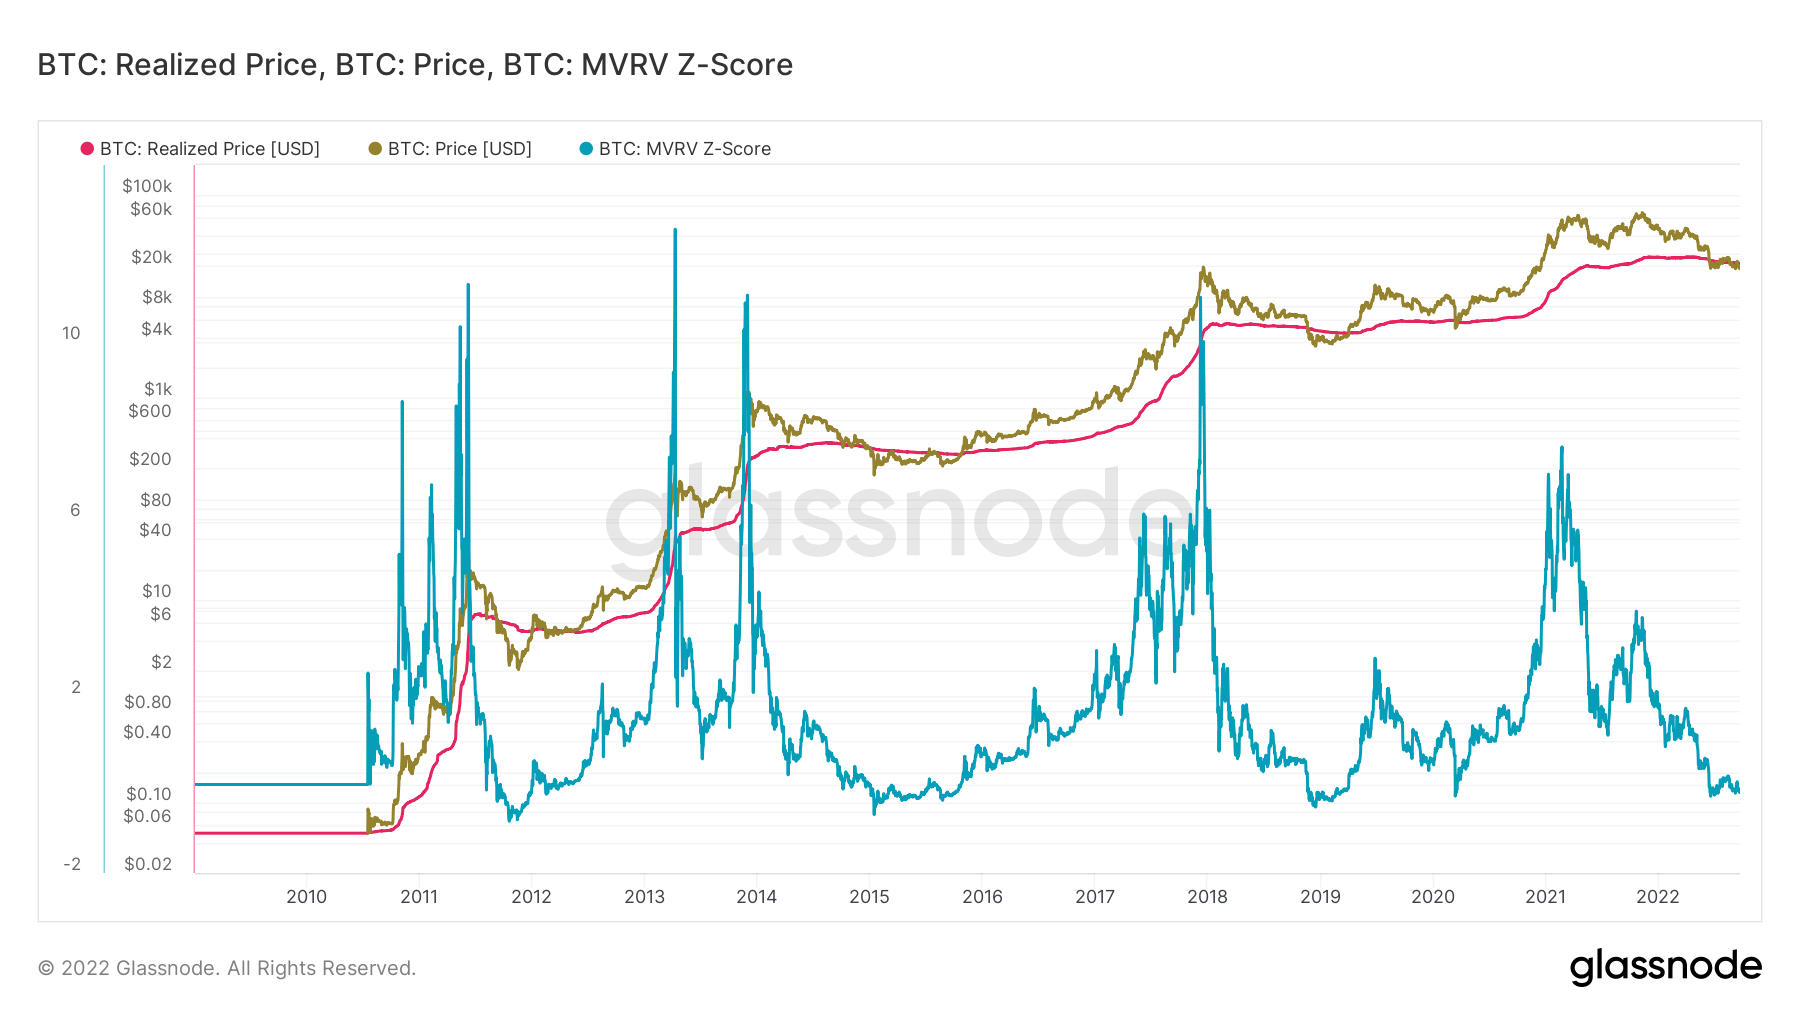
However, certain metrics such as the MVRV Z-Score can be used to determine the price performance of an asset.
MVRV Z-score is based on three calculations – Market Value (MV), Realized Value (RV) and Z-score. The realized score is the price of each Bitcoin since it was transferred across wallets, while the Z-score is the deviation test between market value and realized value.
So, MVRV Z-Score is defined as the ratio of market value to realized value and the standard deviation of all historical market value data ie (market value – realized value) / std(market value).
Most times, the MVRV Z-Score can be used to determine whether Bitcoin is over or undervalued. Historically, when market value is significantly higher than realized value, it indicates a market top (red zone), while the opposite means a market bottom (green zone). MVRV Z-score shows that BTC is undervalued as the realized price is slightly higher than the market price.
The score is currently in the green zone, suggesting a market bottom, and has been there since the Terra LUNA collapse.
From and including 21 September, the Z-score was -0.14, which clearly shows that the market value is less than the realized value. The MVRV at that time was 0.87.
Compared to previous bear markets in 2020, 2019, 2014 and 2011, the market was in this zone between 20 days to 300 days, suggesting that BTC’s price may remain in this range for six more months.
Meanwhile, the fact that MV shows that we may have bottomed out does not mean that BTC can still fall lower. However, falling below $17,500 – the next resistance level – suggests that this is no ordinary bear market.
Former BitMEX CEO Arthur Hayes pointed this out in one of his essays. According to him, traders in long positions on Bitcoin should be wary of $17,500.
Hayes continued that much of Bitcoin’s price depends on liquidity in the US dollar, which has been tightening since November 2021. With the Fed planning to further remove liquidity, the hawkish stance could test Bitcoin’s resilience at that mark.


