Hive Blockchain is set to de-anchor from historical best-in-class operating efficiency (HIVE)
Lingbeek/E+ via Getty Images
Introduction
We have covered HIVE Blockchains (NASDAQ:HIVE) pivoted after Ethereum’s (ETH-USD) transition to Proof-of-Stake (‘PoS’) and showed that the impact of PoS ETH is only expected to reduce HIVE’s top line by 13% under several assumptions. One of the prerequisites has been violated while HIVE’s September production update helped fill the knowledge gap for more accurate expectations.
Before the transition, we had only good things to say about HIVE, which included:
- Lower ESG compliance risk (powered by 100% renewable energy)
- Increasing Bitcoin (BTC-USD) reserves.
- Acceptable margin of safety in the form of price for hard assets over total debt ratio
- Significantly lower all-in business cost per BTC by industry standards.
We noted that there was a catch to these findings, which is the late release of HIVE’s CY2022Q1 report. It turns out we were right to exercise caution. Therefore, this paper aims to adjust HIVE’s future performance expectations by consolidating the CYQ1/Q2 performances in conjunction with our initial analysis and Hut 8’s (HUT) latest guidance.
Deviation from historical averages
Prior to 2022Q1, HIVE’s all-in business cost per Bitcoin was anchored near the $20,000 level while operating costs (excluding depreciation) were anchored at around $5,000. This gave us high confidence that there is no significant risk of HIVE ceasing operations and no indications of declining storage of mined Bitcoin and Ethereum.
However, HIVE reported almost 3x higher all-in business costs per BTC in CY2022Q1. Contributors to the cost increase include a 4x increase in O&M costs, over 2x increase in depreciation and a 50% increase in general and administrative costs. More importantly, these cost increases are expected to be sticky.
Table 1. HIVE’s historical expenses
|
QR(CY) |
Total business Cost |
Operation and Maintenance ($miles) |
Depreciation ($mil) |
General and Admin ($mil) |
Share-based values ($mil) |
Economy ($miles) |
|
2022Q2 |
48.3 |
17.2 |
25.7 |
3.4 |
1 |
1 |
|
2022Q1 |
68.72 |
26.91 |
35.5 |
4.3 |
1.28 |
0.73 |
|
2021Q4 |
27.4 |
6,526 |
15 |
2,862 |
1,672 |
1,338 |
|
3rd quarter 2021 |
22 |
7.6 |
9.6 |
2.63 |
1.48 |
0.305 |
|
2021Q2 |
18 |
6.2 |
6.9 |
2.3 |
2.3 |
0.3 |
Indications of higher costs for renewable energy
HIVE explained that the 4x increase in operating costs was mainly due to seasonally high electricity costs in some jurisdictions. Seasonal means that this will not be a one-time cost and will happen again. More importantly, this also confirms the disadvantage of only limiting power sources to only renewable energy, more so if it is only limited energy just like Soluna (SLNH). Another example is HUT, which also operates exclusively on renewable energy.
HUT reported a 50% increase in operating costs in 2022Q2, also mainly contributed by higher energy costs. However, according to the Canadian Energy Price Index, energy prices remained stable in Q1 and Q2, while there was even a 12% decrease in Q2. Therefore, it does not make sense for HUT, which only operates in Canada, to suffer from an increase in electricity costs.
Our hypothesis is that there is a difference in price between the general cost of electricity and the cost of renewable energy. The cost of renewable energy is a function of demand and constraints. The smaller the shortening, the more expensive the energy (fig 1). This is supported by HIVE’s own statements:
HIVE has encountered some seasonally high electricity prices in some of its operating jurisdictions (including electrical curtailment at the request of utility providers for load balancing).
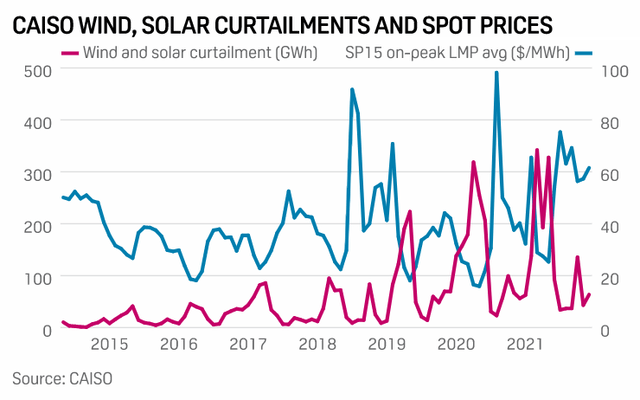
Fig 1. Reduction vs spot price (CAISO)
Although there is a 37% QoQ decrease in operating costs for CY2022Q2, it is still 3 times higher than the figures for CY2021Q4, CY2021Q3 and CY2021Q2.
It is inevitable for HIVE to require more energy as it aims to triple its mining capacity from ~2 EH/s to ~6 EH/s. Therefore, the less renewable energy is reduced, the higher the costs.
Based on this hypothesis, HIVE’s operating expenses for the third quarter are expected to remain high, and this will anchor HIVE’s historical average for operating efficiency in the class.
Depreciation exceeds capacity growth
According to Table 1, depreciation accounts for more than half of HIVE’s business costs. But more importantly, HIVE’s depreciation costs outpaced the growth in mining capacity.
It is only logical that depreciation increases as HIVE grows in capacity. More machines = more capacity = more depreciation.
In HIVE’s case, depreciation charges increased 4x between CY2022Q1 and CY2021Q4 and 3x between CY2022Q2 and CY2021Q4. However, the equipment value only increased by 65% and 60% respectively in the periods.
Some may wonder if the rate of depreciation is due to obsolescence of equipment. To some extent, yes, but not exactly.
This depreciation coincides with the rapid decline in GPU prices. GPU prices have dropped as much as 90% of their MSRP due to newer GPUs and a drop in demand caused by recession risk and Ethereum’s move to PoS.
Since our latest valuation model evaluates a crypto mining company’s market capitalization minus liquid assets, PP&E and liabilities, HIVE’s current depreciation rate will negatively impact its intrinsic value.
The effect of PoS ETH on cost efficiency
Cost efficiency is defined as the dollar amount of cryptocurrencies mined (production) over the dollar amount of cost. Therefore, the decline in production will also reduce cost-effectiveness.
We previously estimated a 30% decline in altcoin GPU mining revenue or a 13% decline in alt-in revenue if HIVE swings to Ethereum Classic (ETC-USD) assuming running at full capacity and no increase in mining difficulty. This expectation is now obsolete because one of the assumptions was violated. ETC’s mining difficulty increased >3x since our last coverage in August.
Based on ETC’s latest mining difficulty of 130 TH/s, HIVE’s altcoin GPU mining revenue should be reduced by 80% instead. This estimate is consistent with HIVE’s guidance. HIVE stated that GPU mining after “The Merge” generated $20k to $30k in revenue per day, down from $120k to $150k per day, suggesting a ~80% decrease. Therefore, although HIVE did not specify which altcoins HIVE is currently mining, we are going to assume it is ETC since the reported revenue decline is consistent.
HIVE has 6.49 TH/s GPU mining capacity for altcoins. Using the coinwarz.com calculator, a mining capacity of 6.49 Th/s can mine approximately 0.333 million ETC or $8 million to $23.77 per ETC annually, which equates to HIVE’s guidance of $10 million annually ($20,000 to $30,000 per day to = $73mil). 11 million annually).
HIVE’s ETH mining revenue over the last 4 trailing quarters is 30,372 ETH or about $40 million annually at $1,300 per ETH. This represents an 80% drop in altcoins GPU mining revenue. Therefore, the 80% drop in GPU mining revenue is justifiable. Since approx. 40% (table 2) of HiVE’s income came from ETH in the 2nd quarter, HIVE’s net income will decrease by 32%.
This decline in altcoin GPU mining revenue is simply a return to normalcy:
From the beginning of Ethereum the idea of an eventual exchange (the “Merge”) to proof of stake (“Proof-of-Stake”) from employment certificate (“Proof-of-Work”) has been present in the Ethereum Foundation. Due to unique technical challenges, this transition has had many delays. The uncertainty regarding the timing of the merger is one of the elements that likely helped make HIVE’s investment in GPU-based Ethereum mining so successful and profitable over the years.
HIVE’s total business costs for Q1 and Q2 are USD 68.72 million and USD 48.3 million respectively. HIVE’s mining yield for Q1 and Q2 is 1,291 and 1,338 BTC equivalents respectively. Therefore, HIVE’s all-in business costs per BTC for Q1 and Q2 are $53,230 and $36,100 respectively, or $44,500 (= ($68.72mil + $48.3mil) / (1,291 BTC + 1,338 BTC)) on average. Considering the 80% decline in altcoin mining revenue and using Q2 as a benchmark, HIVE’s final all-in Business cost will be $65,000 per BTC (= ($68.72mil + $48.3mil) / (1.291 BTC + 1.338 BTC )*0.68).
This figure is quite reasonable because HIVE reported that altcoin GPU mining has become less profitable to mine than Bitcoin. Daily profit per 25MW:
- ETH GPU mining revenue = $120k to $150k
- BTC ASIC mining revenue = $41k
- Non-ETH altcoins GPU mining revenue = $30k
Table 2: ETH Production %
| QR (CY) | BTC mined | ETH mined | ETH is mined in BTC equivalent | ETH% Production |
| 2022Q2 | 821 | 7675 | 517 | 39% |
| 2022Q1 | 790 | 6,883 | 501 | 39% |
| 2021Q4 | 697 | 7.126 | 523 | 43% |
| 3rd quarter 2021 | 656 | 8,688 | 577 | 47% |
Verdict
We had to re-establish our thesis about HIVE because our assumptions were violated. First, there is sufficient evidence to convince us that HIVE’s cost base is removed from historical averages. Second, HIVE’s mining cost-effectiveness is worsened by the 80% drop in altcoin GPU mining revenue. Third, non-ETH altcoin mining poses additional risks to the already risky and volatile sector.
In addition to the above, we could not find a sufficient investment value proposition in HIVE for the following reasons:
- HIVE ($275.35mil market cap) is trading above its adjusted book value ($227 6mil = 3,359 BTC * $20,000 Bitcoin reserves + $4mil cash, $172mil PP&E + $43.6mil prepaid – $59.2mil total liability) when much larger mining companies are trading below adjusted book value .
- For example, RIOT’s market cap ($982mil) to adjusted book value ($1.05bn = $270mil cash + $411mil PP&E + $20,000 x 6.775 BTC Bitcoin reserve + $376mil prepaid – $147mil total liability) ratio is 0.935
- The All-in Business cost of $65,000 per BTC is simply too uncompetitive in the industry (Table 3, Table 4).
These findings suggest that investing in Bitcoin directly would be the best decision.
Table 3. Cost of income (excl. depreciation) Comp
| Miners | Cost of revenue (CoR, excl. depreciation) |
| HIV | 2022Q2/Q1 Average + 80% Decline in Altcoin GPU Mining Revenue: $24,700 = ($26.91mil + $17.2mil) / ( (1.291 + 1.338 BTC)*0.68 ) |
| MARA | 2022Q2: Void due to Montana one-off disruption2022Q1: $6,240 = $7.86mil CoR / 1259 BTC mined2021Q4: $6500 = $7.1mil CoR / 1098 BTC mined |
| BITF | $12,000 |
| COTTAGE | Q2: $20,200 = $19.1mil CoR / 946 BTC mined Q1: $13,800 = $13mil CoR / 942 BTC mined |
| RIOT | Q2: $12,900 = $18mil CoR / 1395 BTC mined Q1: $13,500 = $19mil CoR / 1405 BTC mined |
| CLSK | Q2: $9,600 = $10.3mil CoR / 964 BTC mined |
Table 4. All-in Business Cost per BTC Comps
| Miners | All-in-business cost per BTC |
| HIV | 2022Q2/Q1 Average + 80% Decline in Altcoin GPU Mining Revenue: $65,500 = ($48.3mil + $68.72mil) / ((1,291 + 1,338 BTC)*0.68) |
| MARA | 2022Q2: Not valid2022Q1: $31,700 = $40mil all-in costs / 1,259 BTC mined2021Q4: $32,240 = $28.57mil all-in costs / 1,098 BTC mined |
| BITF | Q2 |
| COTTAGE | 2022Q2: $49,500 = $46.8mil all-in costs / 946 BTC mined 2022Q1: $40,750 = $38.4mil all-in costs / 942 BTC mined2021Q4: $40,200 = $31.7mil 89 BTC |
| RIOT | 2022Q2: $35,300 = $49.3mil all-in costs / 1,395 BTC mined2022Q1: $30,800 = $43.25mil all-in costs / 1,405 BTC mined |
| CLSK | 2022Q2: $37,800 = $36.4mil all-in costs / 964 BTC mined |
Source: Author


