Global markets and Bitcoin on macro support, all eyes on DXY
Global markets and cryptocurrencies have experienced deep declines for months. The strong correlation between Bitcoin’s price and traditional stock markets further exacerbates this trend. All this dominates the parabolic rise of the US dollar index, which is only accelerating.
However, global markets and their major indices have reached long-term support levels that could mark the spot for a rally. Moreover, the DXY is slowly reaching its own macro resistance, which could stop the exponential rise of the US dollar.
In today’s analysis, BeInCrypto looks at the SPX and NASDAQ price action in conjunction with the BTC and altcoins charts. We then look at the DXY chart and its rapid dominance over other global currencies. It all culminates with some harmonic analysis that hints at an upcoming bounce.
Global markets in a downward trend
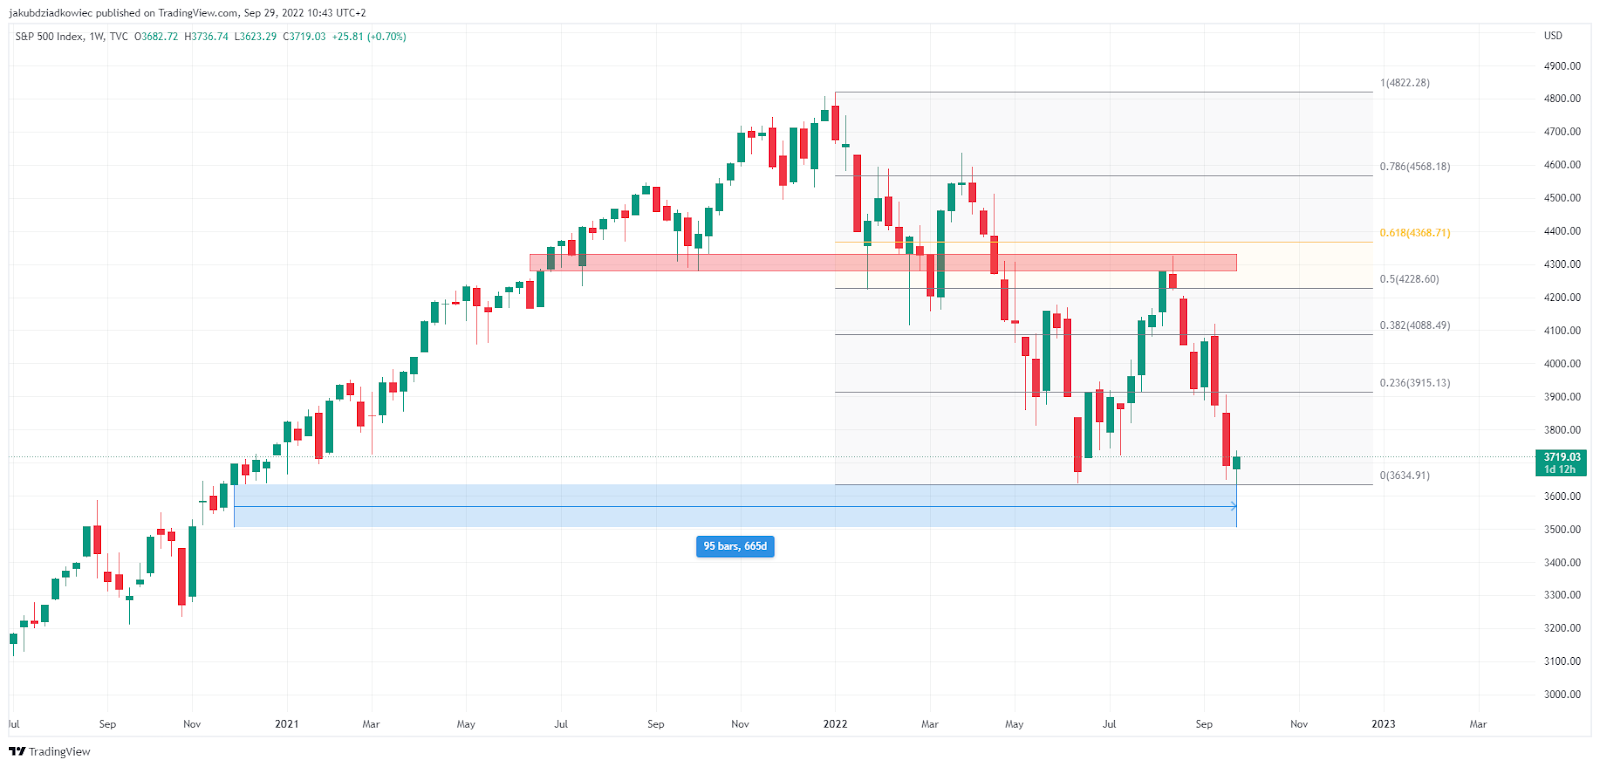
The S&P 500 (SPX) chart has been in a bearish trend since it hit an all-time high (ATH) of $4,818 on January 4, 2022. Shortly after, the ongoing decline began, and the index hit a nearly 2-year low (665 days) yesterday. The SPX retreated to the $3,624 level, losing nearly 25% from its ATH.
If the SPX starts a bounce at this point, a double bottom pattern may be in place. In June, the index fell to the $3,636 level, only to return to the $4,325 area, which previously served as support (red rectangle). This resistance is located in the area of the 0.618 Fib retracement, measured for the entire downward movement.
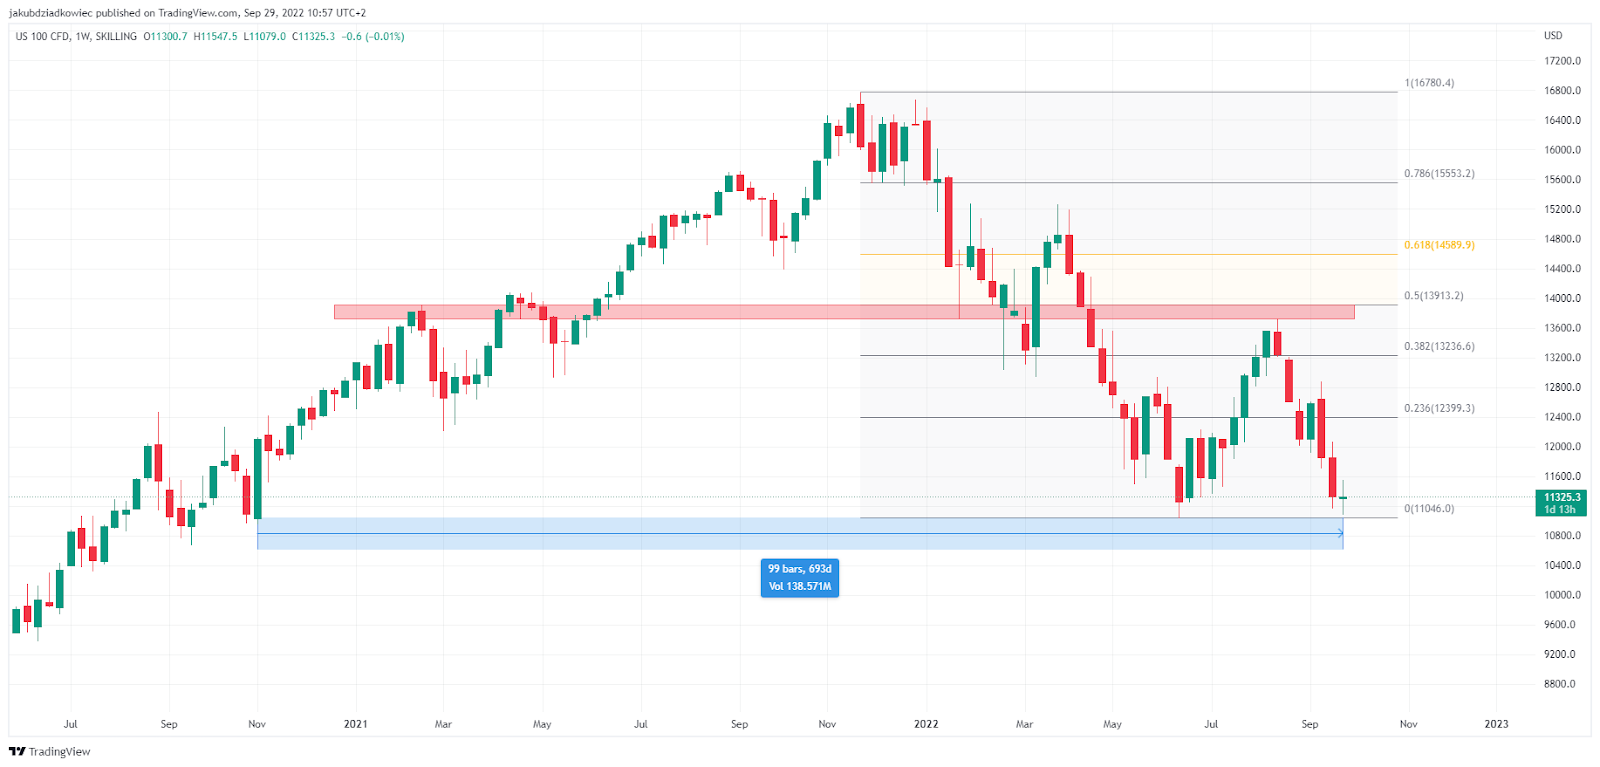
The NASDAQ chart is similar to the SPX, but the drop from the ATH was stronger and the bounce from the bottom was weaker. The index reached an all-time high of $16,770 on November 22, 2021. This occurred less than two weeks after Bitcoin’s ATH of $69,000 on November 10.
So far, the decline has led to the $11,035 level reached on June 16, which is 34% below the ATH. The short-term bounce that took place this summer reached an area of resistance/support at $13,727 just below the 0.5 Fib retracement of the entire downward move.
Also on this chart, a double bottom pattern is possible, but the NASDAQ needs to initiate a strong pullback. The last time we saw prices this low on the index of technology companies was in November 2020, 693 days ago.
Shorting macro support? Not the best idea
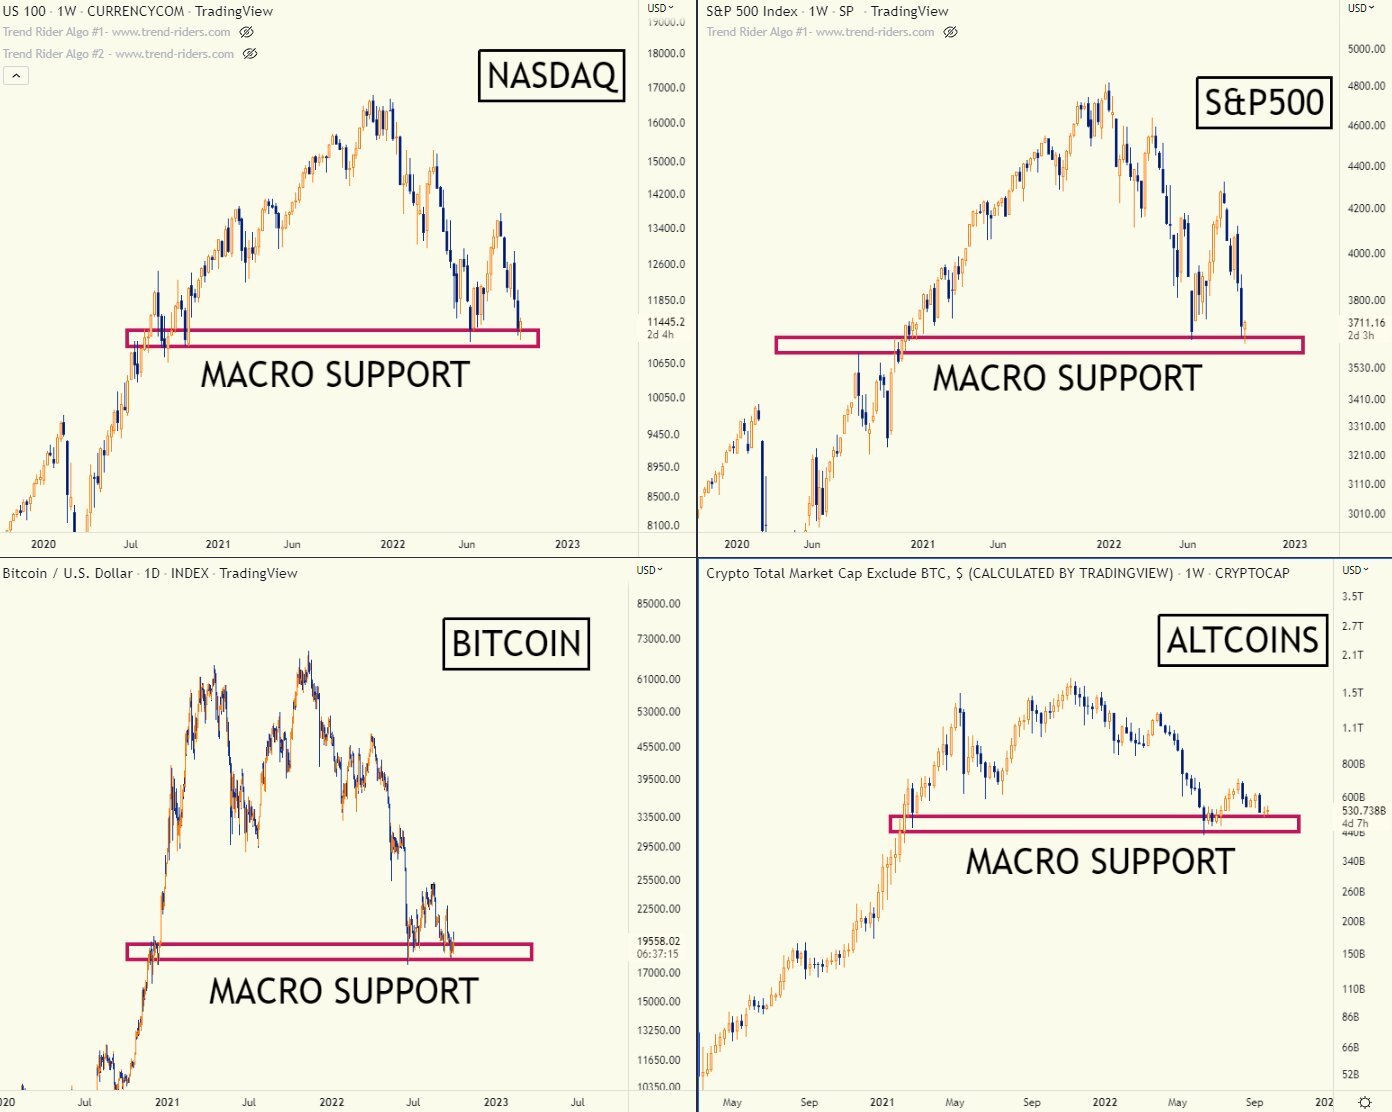
Traditional markets and cryptocurrency analyst @TrendRidersTR tweeted 4 charts: SPX, NASDAQ, Bitcoin and altcoins. According to him, on each of them it is currently possible to mark areas with macro support that can help stop long-term declines.
He goes on to say that “markets have reached a major risk/reward zone with clear invalidation levels.” Only if the levels marked below are lost will global markets remain long-term bearish.
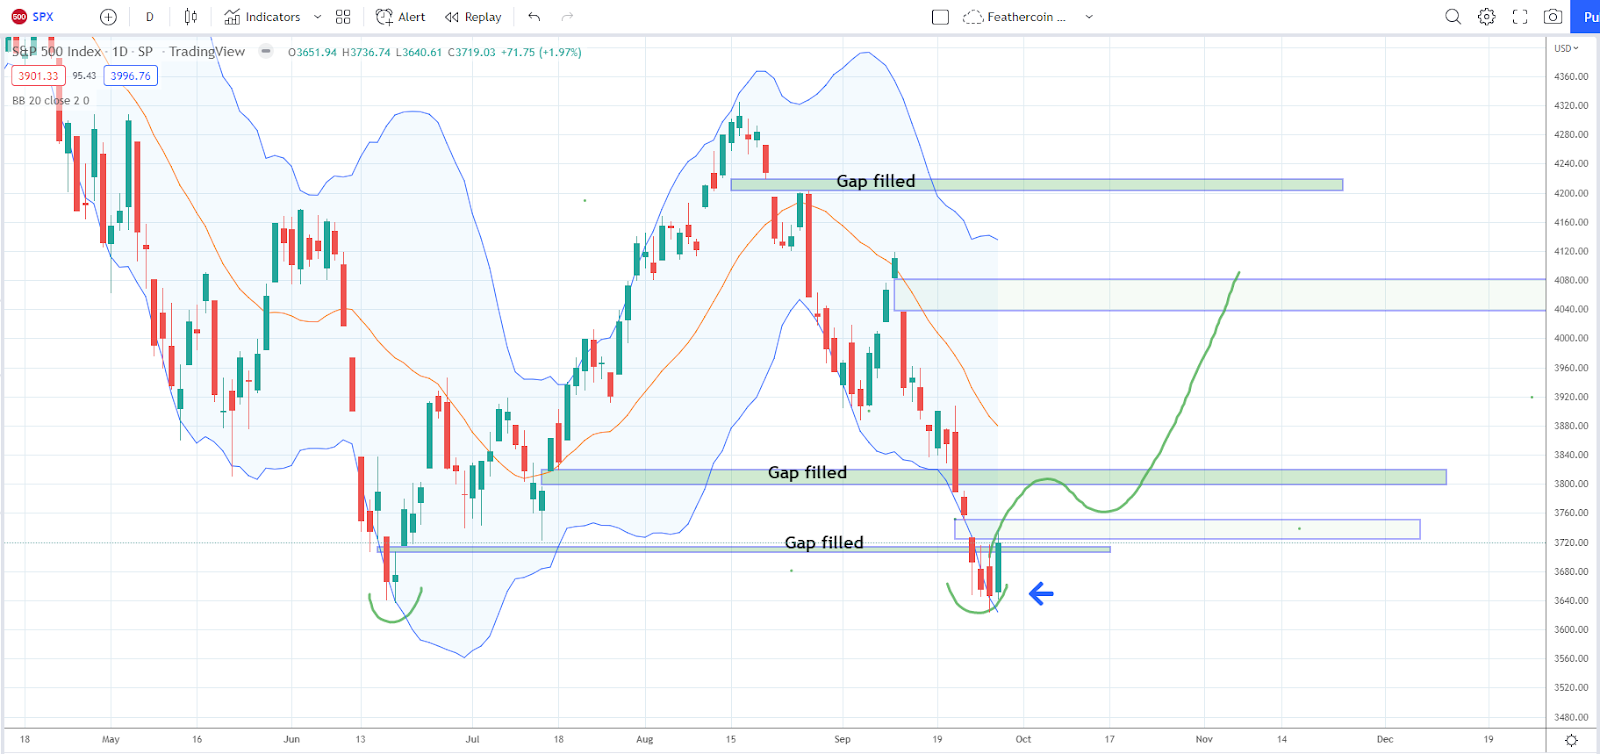
Supporting the above argument is a tweet from another analyst @IncomeSharks, which looks at the behavior of retail investors in the context of the S&P 500 price. He claims that there is currently a “record number of shorting and buying positions in the retail trade. Right at major horizontal $SPX support.” The analyst expects a short squeeze and a bounce to the $4,040-4,080 range.
All eyes on DXY
The primary determinant of the continued price action of global markets and cryptocurrencies is the US Dollar Index (DXY). The value affects not only stock and digital asset markets, but also the world’s most important currencies.
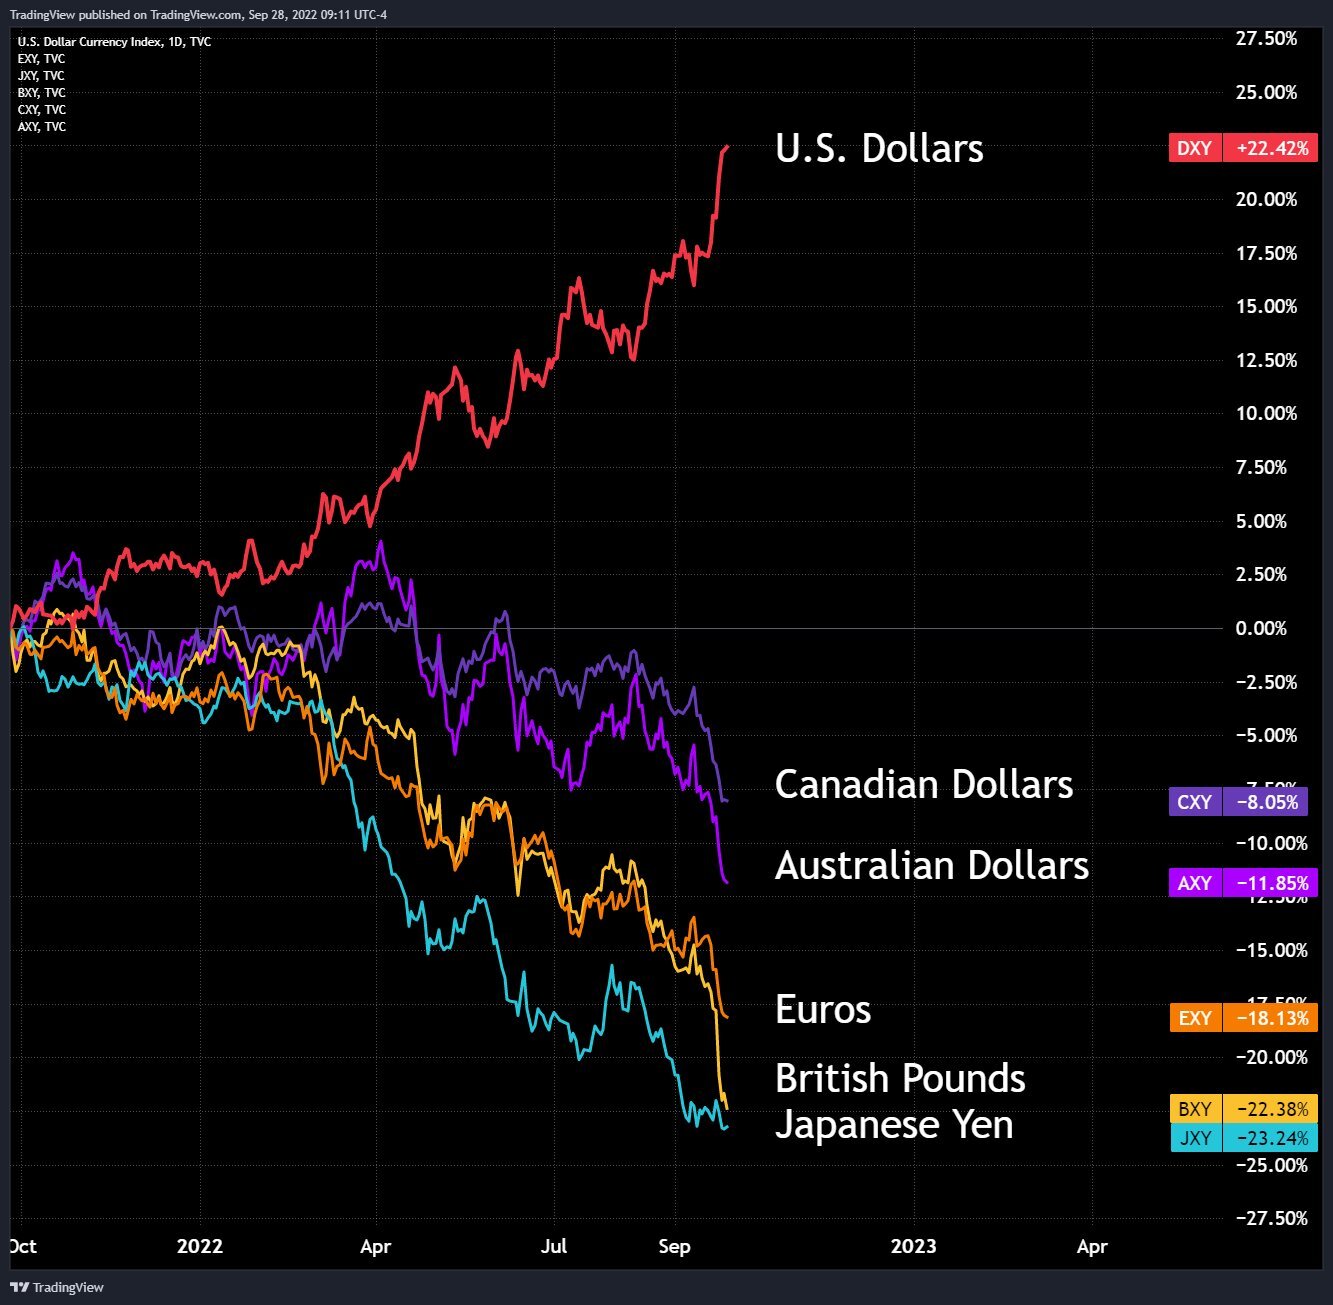
An annual chart of the USD against several major currencies was published on the official @tradingview Twitter account. It shows not only the dollar’s rising parabola, but also its negative correlation with all other currencies.
For example, the euro lost 18.13% year-on-year, and the Japanese yen lost a whopping 23.24%. The US dollar, meanwhile, rose 22.42 percent. The deviation already seems so large, and the recent declines so steep, that a reversal of this trend is becoming increasingly likely.
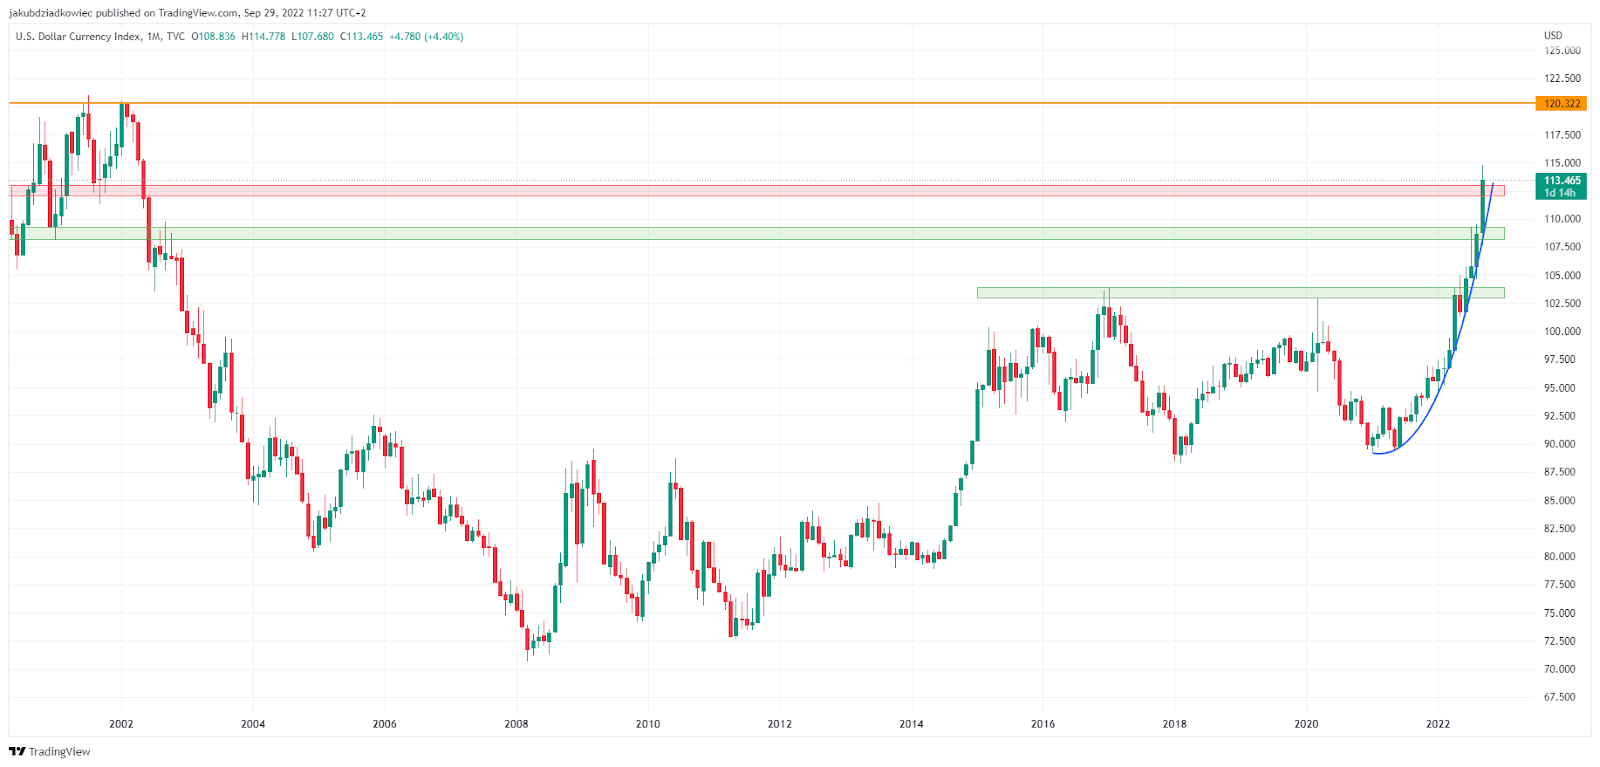
In a previous analysis, BeInCrypto pointed out that DXY’s parabolic wave may not end until historical resistance in the 119-120 area. However, this will still mean an increase of around 6% from today’s valuation, which will certainly affect markets and currencies further negatively.
Currently, DXY is trying to close a monthly candlestick above resistance at 113 (red rectangle). If successful, it will be highly likely to reach the 120 level in a further step.
Harmonic patterns to the rescue
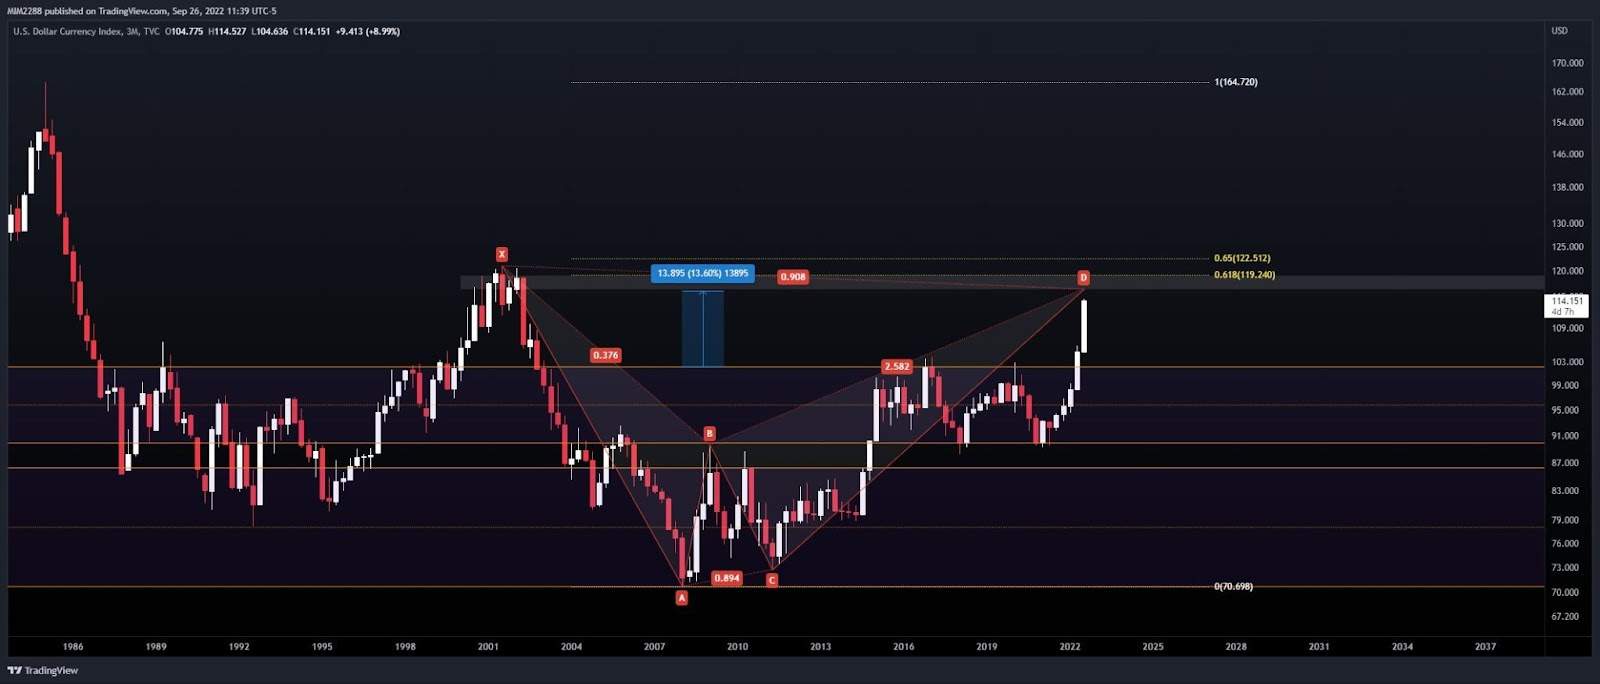
An interesting harmonic analysis of SPX and DXY was posted on Twitter by analyst and trader @MagicInternetM1. Harmonic patterns use geometry and Fibonacci numbers to determine exact turning points. Based on this, they try to predict future movements in asset prices. Gartley, bat and crab are among the most popular formations in harmonic analysis.
In the published analysis, we see a bearish bat formation on the 3-month DXY chart. The peak D is located in the aforementioned 119-120 resistance zone. Further confluence is provided here by the long-term 0.618 Fib retracement level.
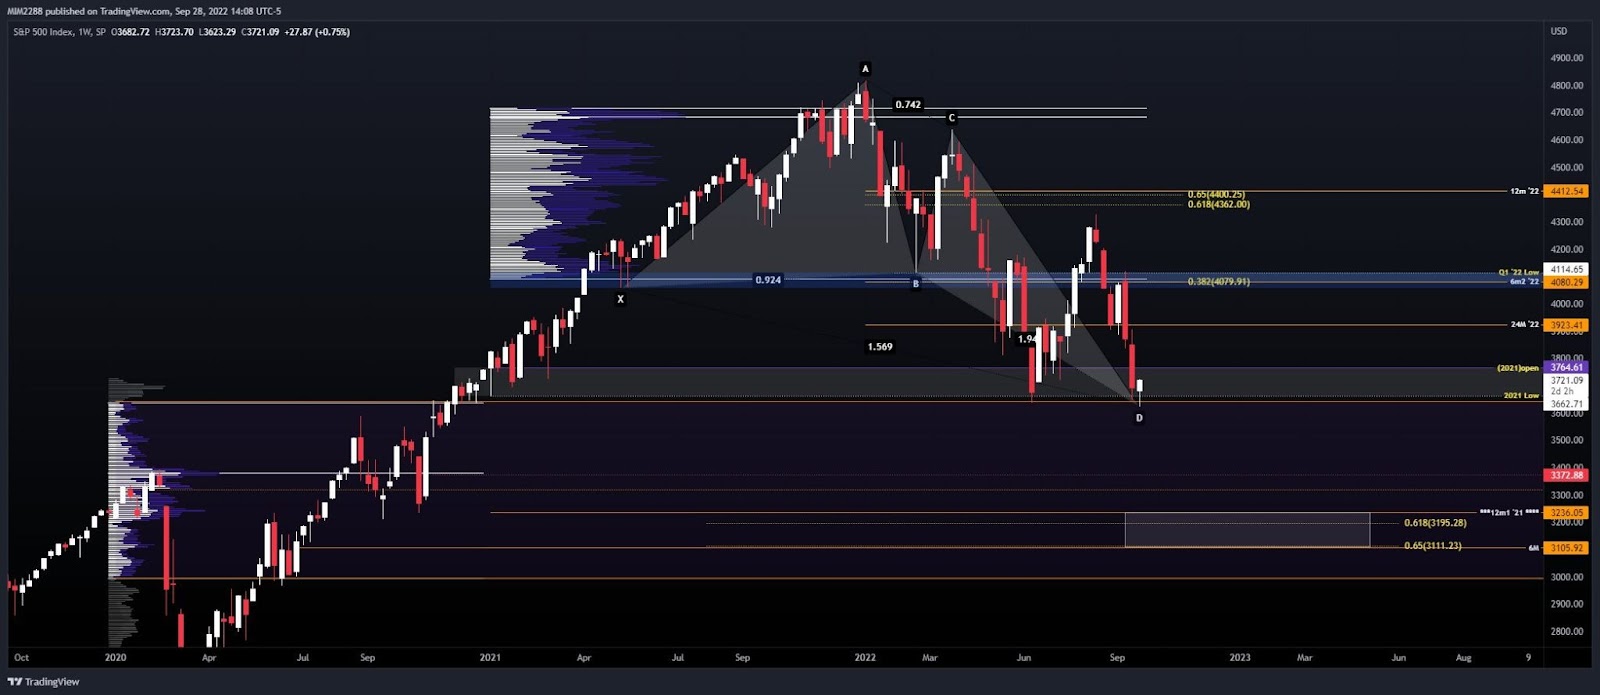
On the other hand, a bullish deep crab formation is outlined on the weekly chart of the SPX. Here, the final D peak may already be reached. A potential bounce could lead to the $4,050-4,100 area in the 0.382 Fib retracement level, which is also the Q1 2022 low. This area remains in line with the bullish target found above in the second part.
Summarizing the above analysis, it can be concluded that there are more and more signals indicating an imminent end to the cycle of falling asset prices and the rising US dollar. Although no one knows where and when the current bear market will end, the likelihood of at least one in the medium term is increasing.
For Be[In]Crypto’s Latest Bitcoin (BTC) Analysis, click here.
Disclaimer
All information on our website is published in good faith and for general information purposes only. Any action the reader takes on the information contained on our website is strictly at their own risk.


