Glassnode: Bitcoin demand is slowly returning after months of decline
Data from Glassnode shows that demand on the Bitcoin network has gradually recovered recently, after facing months of continuous decline.
The total number of coins in the Bitcoin Mempool has been on the rise over the past month
According to the latest weekly report from Glassnode, the BTC network has observed a small but sustained increase in activity recently.
“Mempool” is a (virtual) place where Bitcoin transactions that have not yet been confirmed sit idle and wait to be processed by the miners.
When Mempool has a large size, it means that there are many pending transactions on the network right now. This may indicate that the chain is currently seeing high activity.
An indicator from Glassnode is “Mempool total amount of coins”, which measures how much BTC is inside Mempool at the moment.
Increases in this metric may indicate that there are larger transactions and/or a higher number of them taking place on the Bitcoin blockchain at the moment.
Now, here’s a chart showing the trend in BTC Mempool’s total number of coins over the past twelve months:
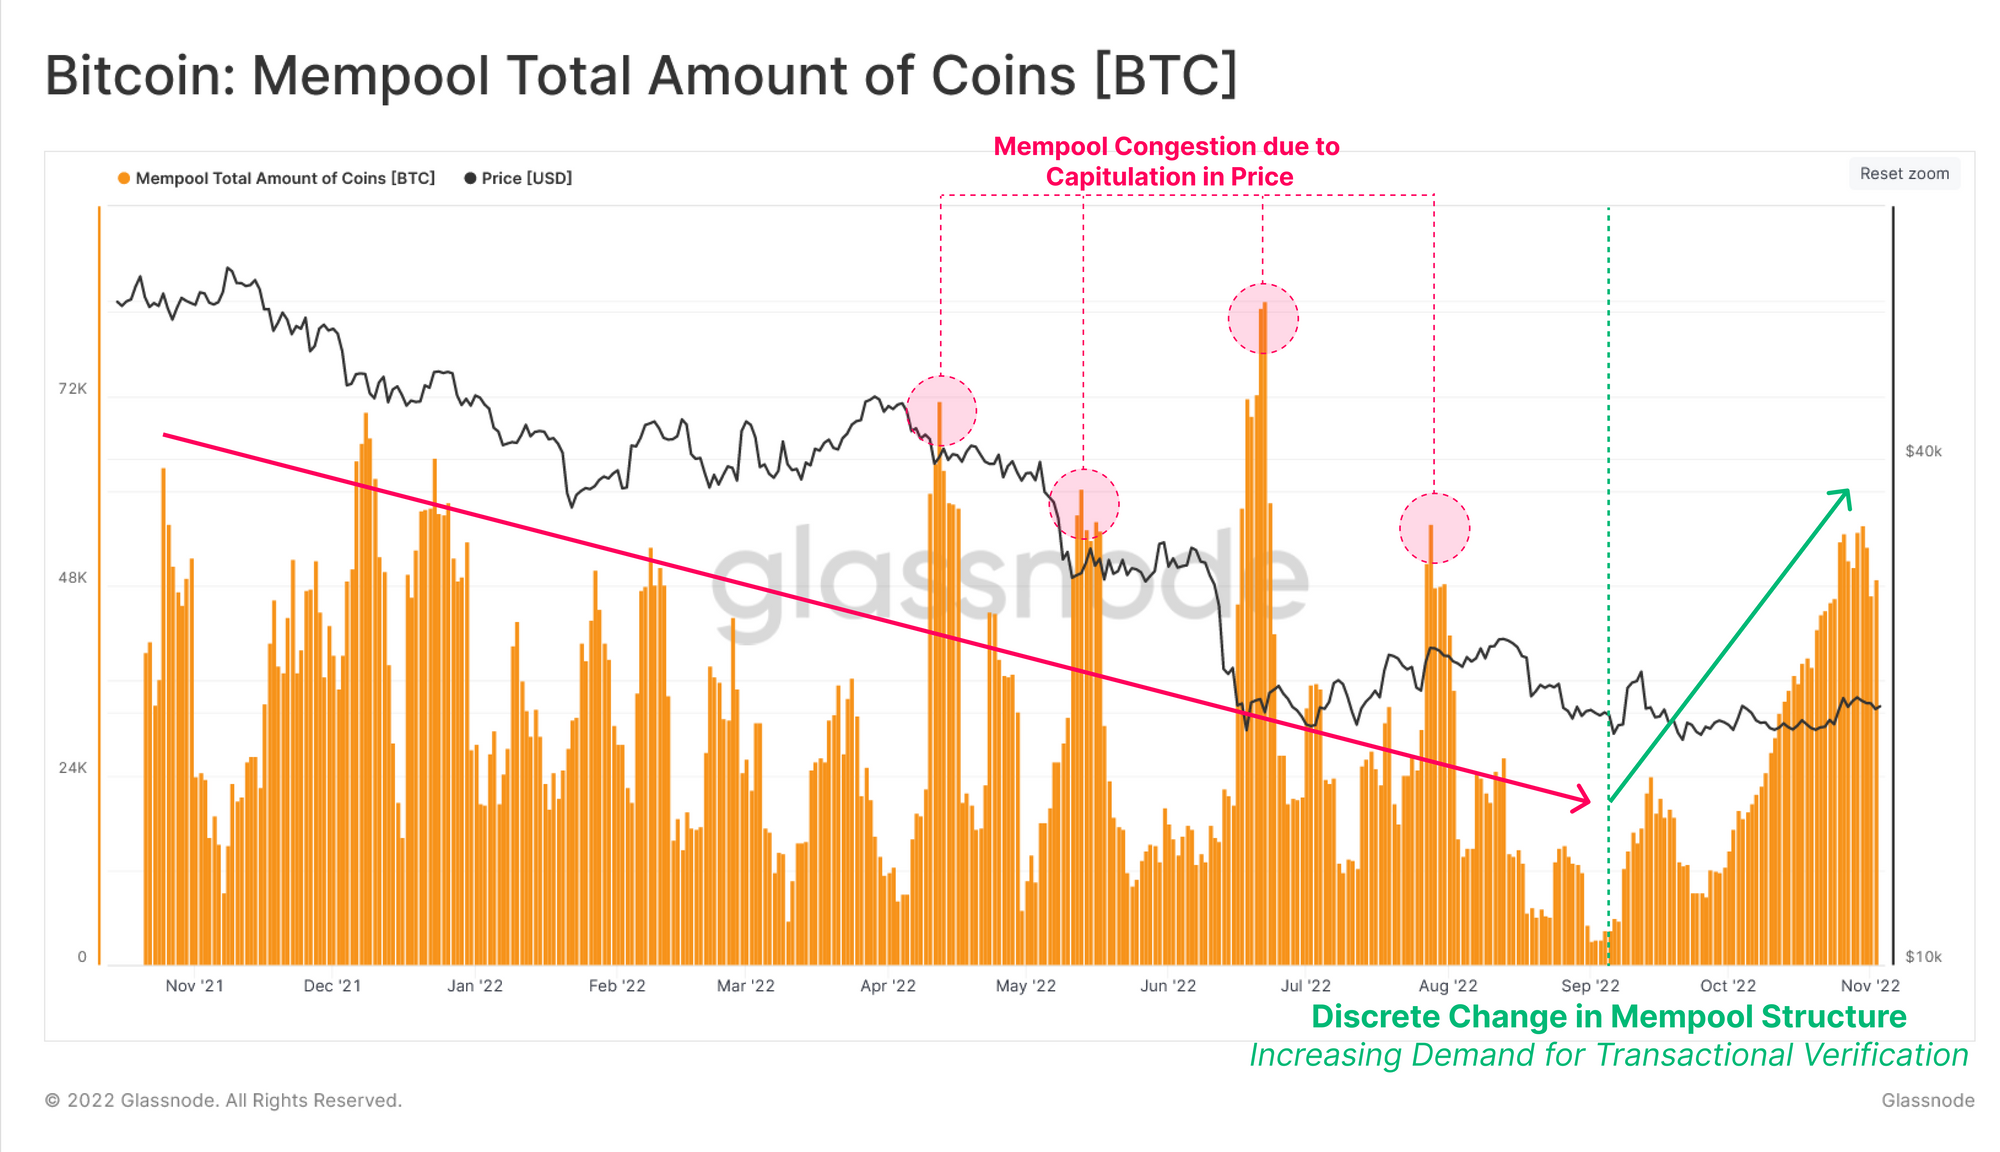
Looks like the value of the metric has been on the up in recent days | Source: Glassnode's The Week Onchain - Week 45, 2022
As you can see in the graph above, the total amount of coins in the Bitcoin Mempool was on a constant decline for most of the past year.
This means that as the bear market took hold, activity in the chain began to slow down as a smaller and smaller number of investors became interested in trading crypto.
There were still a few out-of-the-ordinary peaks during this downturn, where Mempool was overloaded. These breakouts coincided with the major capitulations in price. Nevertheless, these were only temporary boosts and the metrics fell back to the norm in no time.
However, the trend has changed in the last month or so. During this period, the indicator has seen a sustained upward trend, suggesting that a higher total amount of coins are being moved on-chain now.
Glassnode notes that this could be a first sign that a potentially constructive shift in demand for Bitcoin is currently taking place.
And if so, this trend could turn out to be positive for the price of the crypto in the long term, as high demand is the key to driving the market up.
BTC price
At the time of writing, Bitcoin’s price is hovering around $19.7k, down 4% in the last week.

BTC has plunged down over the past day | Source: BTCUSD on TradingView
Featured image from Kanchanara on Unsplash.com, charts from TradingView.com, Glassnode.com


 Underperforms on Friday, Ethereum Blockchain Under Scrutiny by New York AG While TMS Network (TMSN) Introduces Revolutionary Decentralization and Cryptocurrency Trading")