Does Goldman Sachs stock market forecast apply to Bitcoin?
- Goldman Sachs believes that the stock market will fall 9% in the next three months.
- Since Bitcoin is closely correlated with the S&P 500, it is highly likely that it will follow the same path.
- Strategists at the investment bank see two outcomes depending on the Fed’s pivot – a soft landing and a hard landing.
Goldman Sachs, a multinational investment bank, revealed in a note to investors a gloomy outlook for stock markets in 2023. The analysts believe that a short-term fall in the S&P 500 is likely.
However, Bitcoin has been highly correlated with the stock market and developments in that ecosystem since March 2020. As a result, investors should expect a similar outlook for the major crypto. However, there is a wild card scenario that could start a rally for BTC prematurely.
Bitcoin and stock markets
Bitcoin price developed a high correlation to the S&P 500 after COVID hit the world in March 2020. Since then, the 90-day correlation between the assets has continued to rise, reaching an all-time high of 0.63 on September 22, 2022. Even about this The number has decreased since then, the connection between crypto and stocks is relatively high.
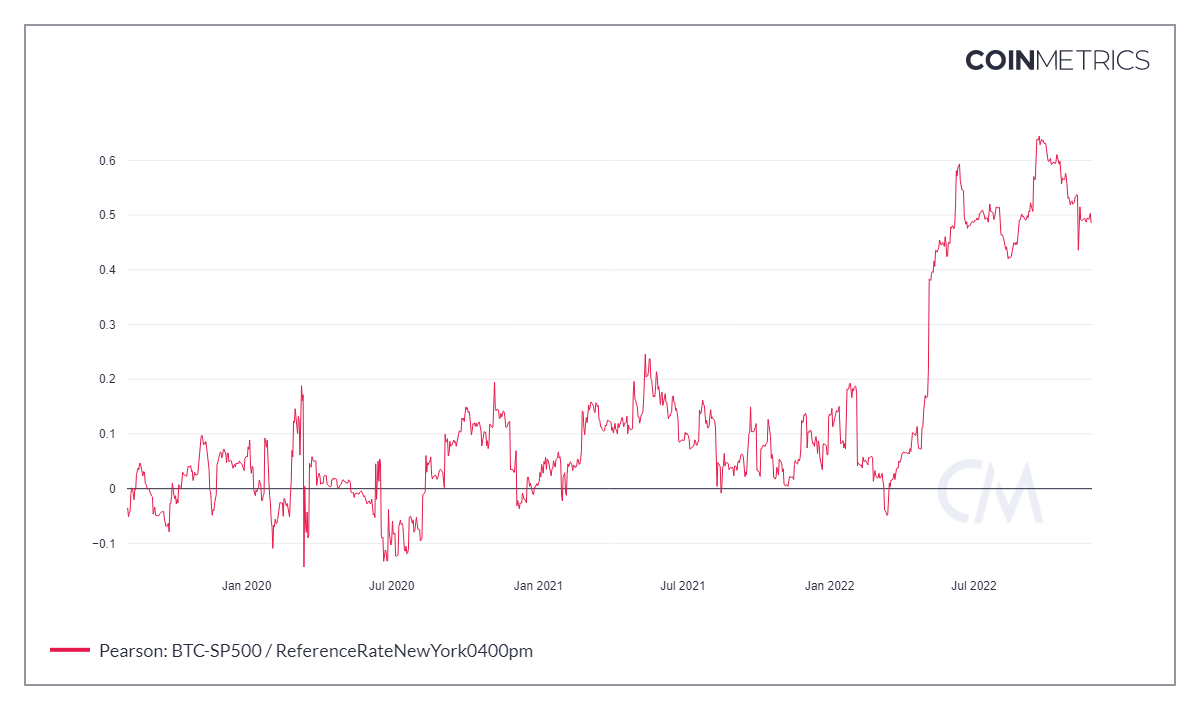
BTC vs. S&P 500 Correlation
Goldman Sachs aims for the S&P 500 to be around 4,000 in the next year, which is roughly where the index is currently trading. This forecast changes based on how the Federal Reserve will control inflation.
If the Feds manage a soft landing, Goldman Sachs strategists believe 3,600 is the bottom. On the contrary, a hard landing could push the S&P 500 down to 3150, aka a 21% crash from its current position.
Bitcoin price and its positive outlook
If the stock market crashes down to 3600, there is a chance that the Bitcoin price will not follow the S&P 500. The reason for this is simple, the major crypto has already been through three massive crashes since the all-time high in November 2021 and has declined approx. 77%.
However, if the index crashes 21%, crypto enthusiasts should entertain the idea of Bitcoin price revisiting the support area, extending from $13,575 to $11,898.
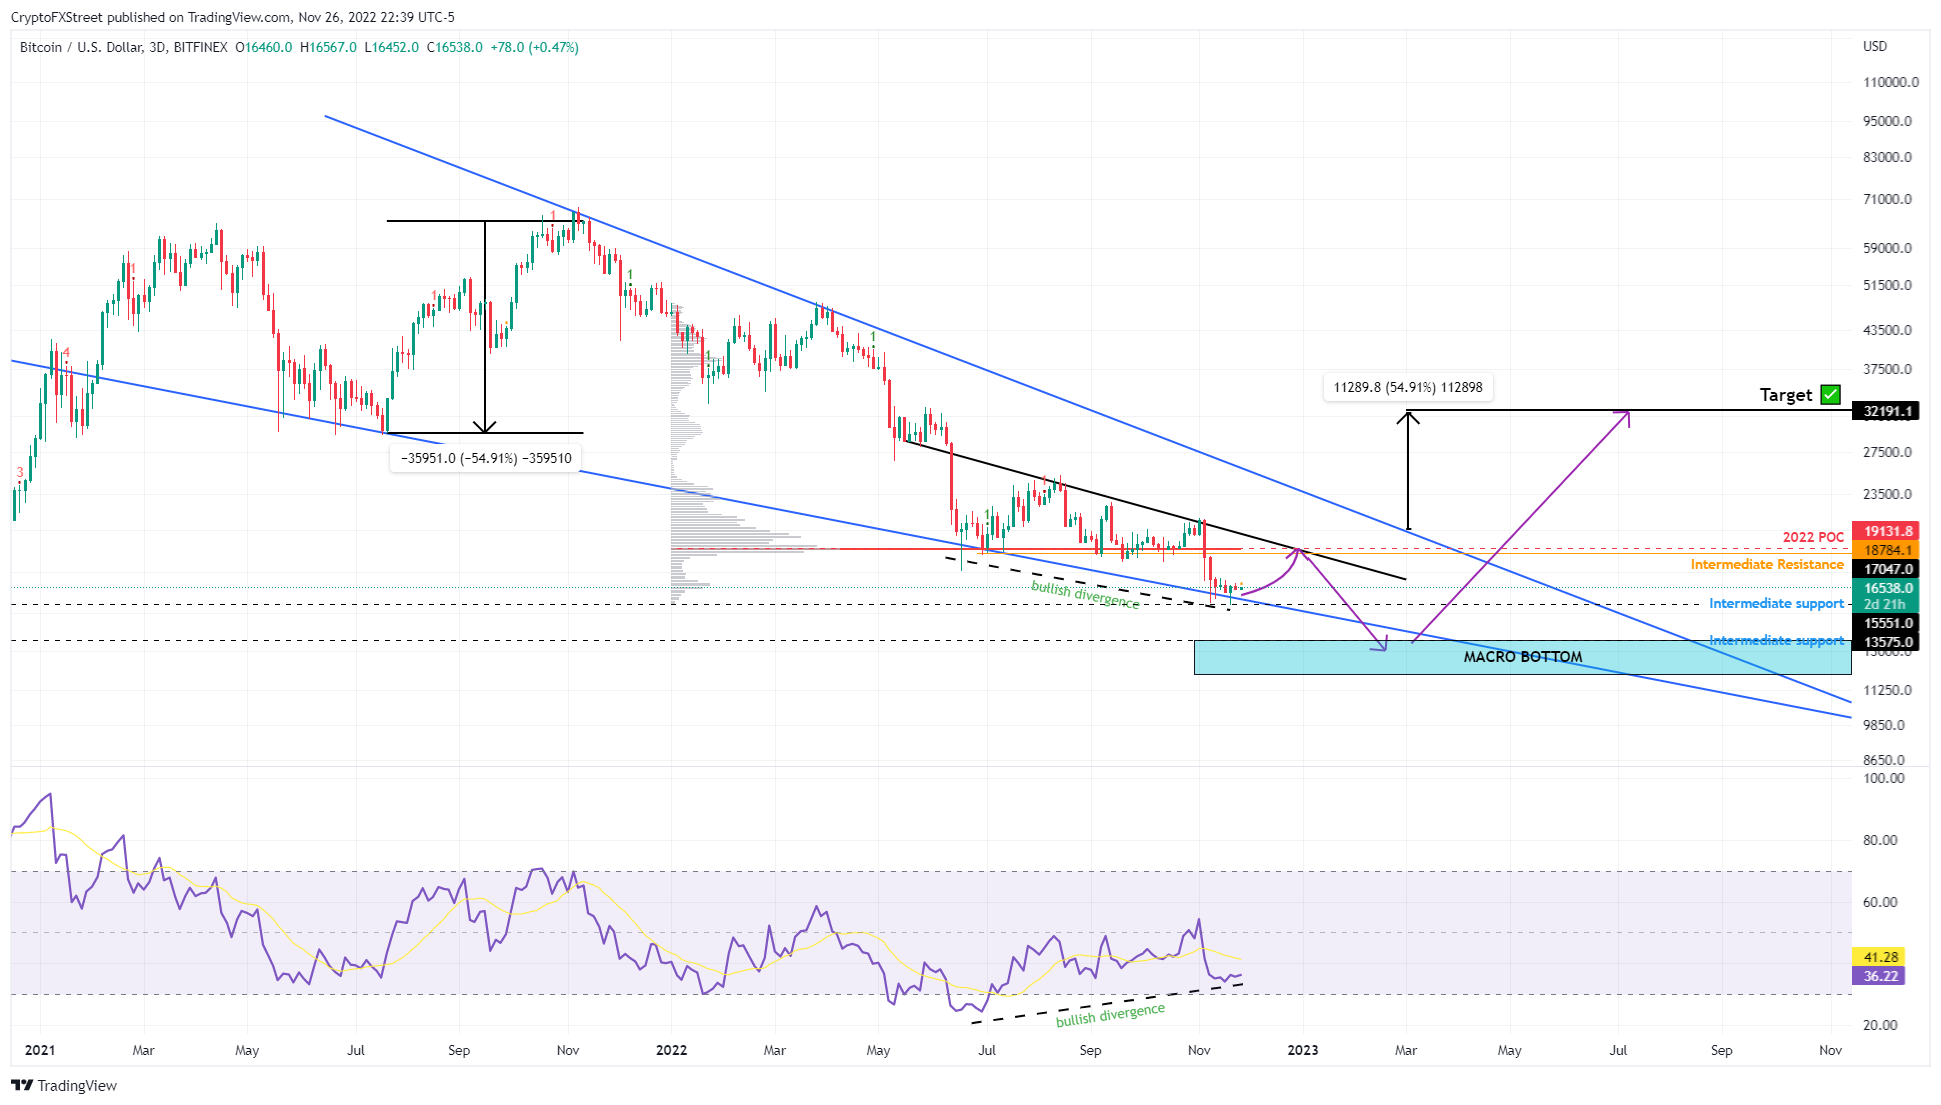
BTC/USDT 3-Day Chart
While the bearish narratives are not set in stone, investors should consider the possibility that the Bitcoin and S&P 500 correlation breaks, allowing BTC to behave like gold, a safe haven. In such a case, things could change drastically, allowing the Bitcoin price, which is currently trading at $16,547, to trigger a rally.
Technicals show that the major crypto is hovering on the lower trendline of a 500-day falling wedge. Adding to this optimistic outlook is the bullish divergence that has developed over the past five months.
If not a 54% breakout move to $32,191 predicted by the falling wedge, investors can expect an 18% rally to $19,011 or a retest of the $20,000 psychological level.


, Apecoin (APE) and EOS (EOS) – Find These Treasure Chests for Massive Wins")