Crypto Market Review, October 18

XRP has a few weeks left to decide if it stays in an uptrend or goes down again
The last week ended poorly for most digital assets in the market despite the large number of signs of improvement we saw throughout the week. Unfortunately, the trend continues and the biggest digital assets are moving in the red zone, including Ethereum, XRP and Cardano.
Now or never for XRP
XRP’s strong rally that began in late September is likely coming to an end as the asset falls below the rising channel that has been leading the price higher. The lack of positive momentum on the asset creates conditions where it desperately needs new inflows or will begin to reverse in the foreseeable future.
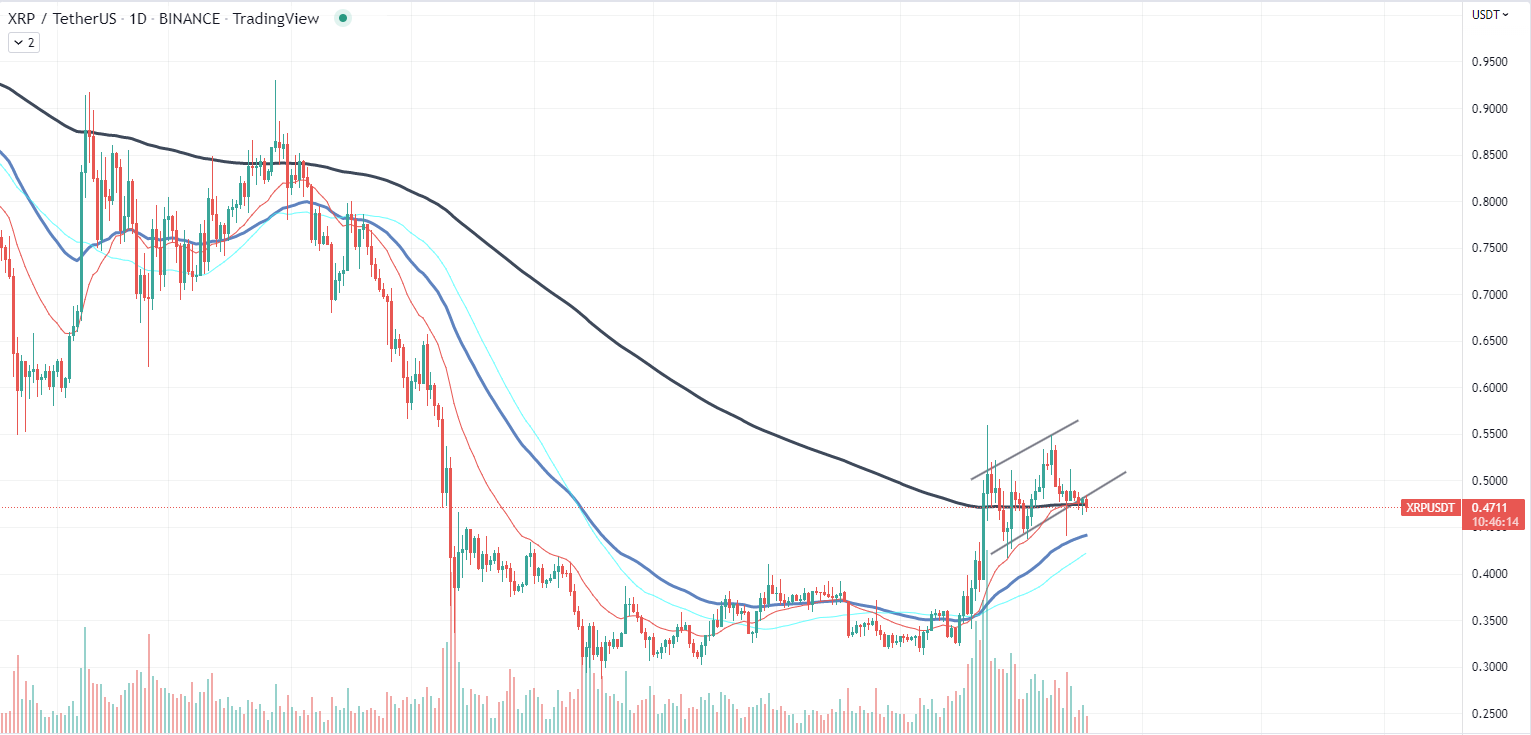
At press time, XRP is trading in the 200-day moving average and will most likely fall below the support level as it has failed to gain a solid foothold above it. The fall below the 200EMA means that investors will not see the crossing between it and the 50EMA, which is a strong bullish signal suggesting that the downtrend is finally over.
Advertisements
All factors now indicate that XRP will continue to move in a downtrend despite the 63% rally. However, the sudden surge in positivity could be seen if Ripple has another big win against the SEC in court. Initially, it was the main fuel for a price increase, but poor market conditions in general prevented XRP from continuing its rally.
Ethereum’s momentum is gone
Despite some strength over the weekend, Ethereum’s price performance returned to “normal” and continued to show almost non-existent volatility and downward movement. Over the past 30 days, Ether’s price performance has continuously moved in the low volatility price channel that the asset returned to on September 23.
The cryptocurrency has returned below the 50-day moving average and will most likely continue to move below the indicator that serves as a guideline for the asset despite the second attempt to break it in the last two weeks.
The most likely scenario from here is the continuation of consolidation despite the nosedive issuance on the network. However, the extended distance limit is not a negative trend for assets. Without the volatility, fundamentally strong assets like Ethereum can attract more investors that will provide fresh inflows that will create a foundation for future rallies in the market.
Unfortunately, market performance or reduced issuance does not provide enough support for assets compared to network revenue and activity.
Bitcoin’s volatility may increase
The performance of assets such as Bitcoin has been similar to the aforementioned cryptocurrencies. The digital gold has been continuously trying to break the local resistance level of the 50-day moving average while moving in the ranking channel.
However, the wave-like structure of Bitcoin’s movement shows that the asset’s volatility could increase dramatically in the foreseeable future as it gets “squeezed” between the lower boundary of the consolidation area and the 50-day moving average.
At press time, Bitcoin is trading at $19,820, showing a mild price increase of 0.37% over the past 24 hours. Ethereum does not follow the performance of BTC as it moves in the negative zone, with its price down by 0.3%.


