Crypto assets are becoming “overbought”, says Santiment
Data from Santiment shows that crypto market assets have now started to enter the “overbought” territory, but they are not yet in danger.
Crypto assets are slightly overbought right now, according to MVRV
According to data from the analysis firm on the chain Sentiment, traders are currently a bit in the green. The relevant indicator here is the “Market Value to Realized Value” (MVRV) ratio, which measures the relationship between the market value of an asset and its realized cap.
The “realized cap” here is a kind of real value model that can be applied to any crypto. Since the MVRV ratio compares the value of the asset (the market value) to this “true value”, the indicator’s value can give hints as to whether the given asset is overpriced or underpriced right now.
When the value of this metric is greater than 1, it means that the market value is higher than the realized value right now, which means that traders on average have some profit. High values above this mark generally suggest that the asset is currently overbought.
On the other hand, values below this mark suggest that the average holder is currently underwater, and therefore the crypto may be currently underpriced.
Now, Santiment has defined an “opportunity zone” and a “danger zone” for MVRV, which, as their names already suggest, are zones where the indicator gives buy or sell signals.
Here is a graph showing how far the MVRV is from these zones (on different time frames, like 1-day, 7-day, etc.) for different assets in the crypto market:

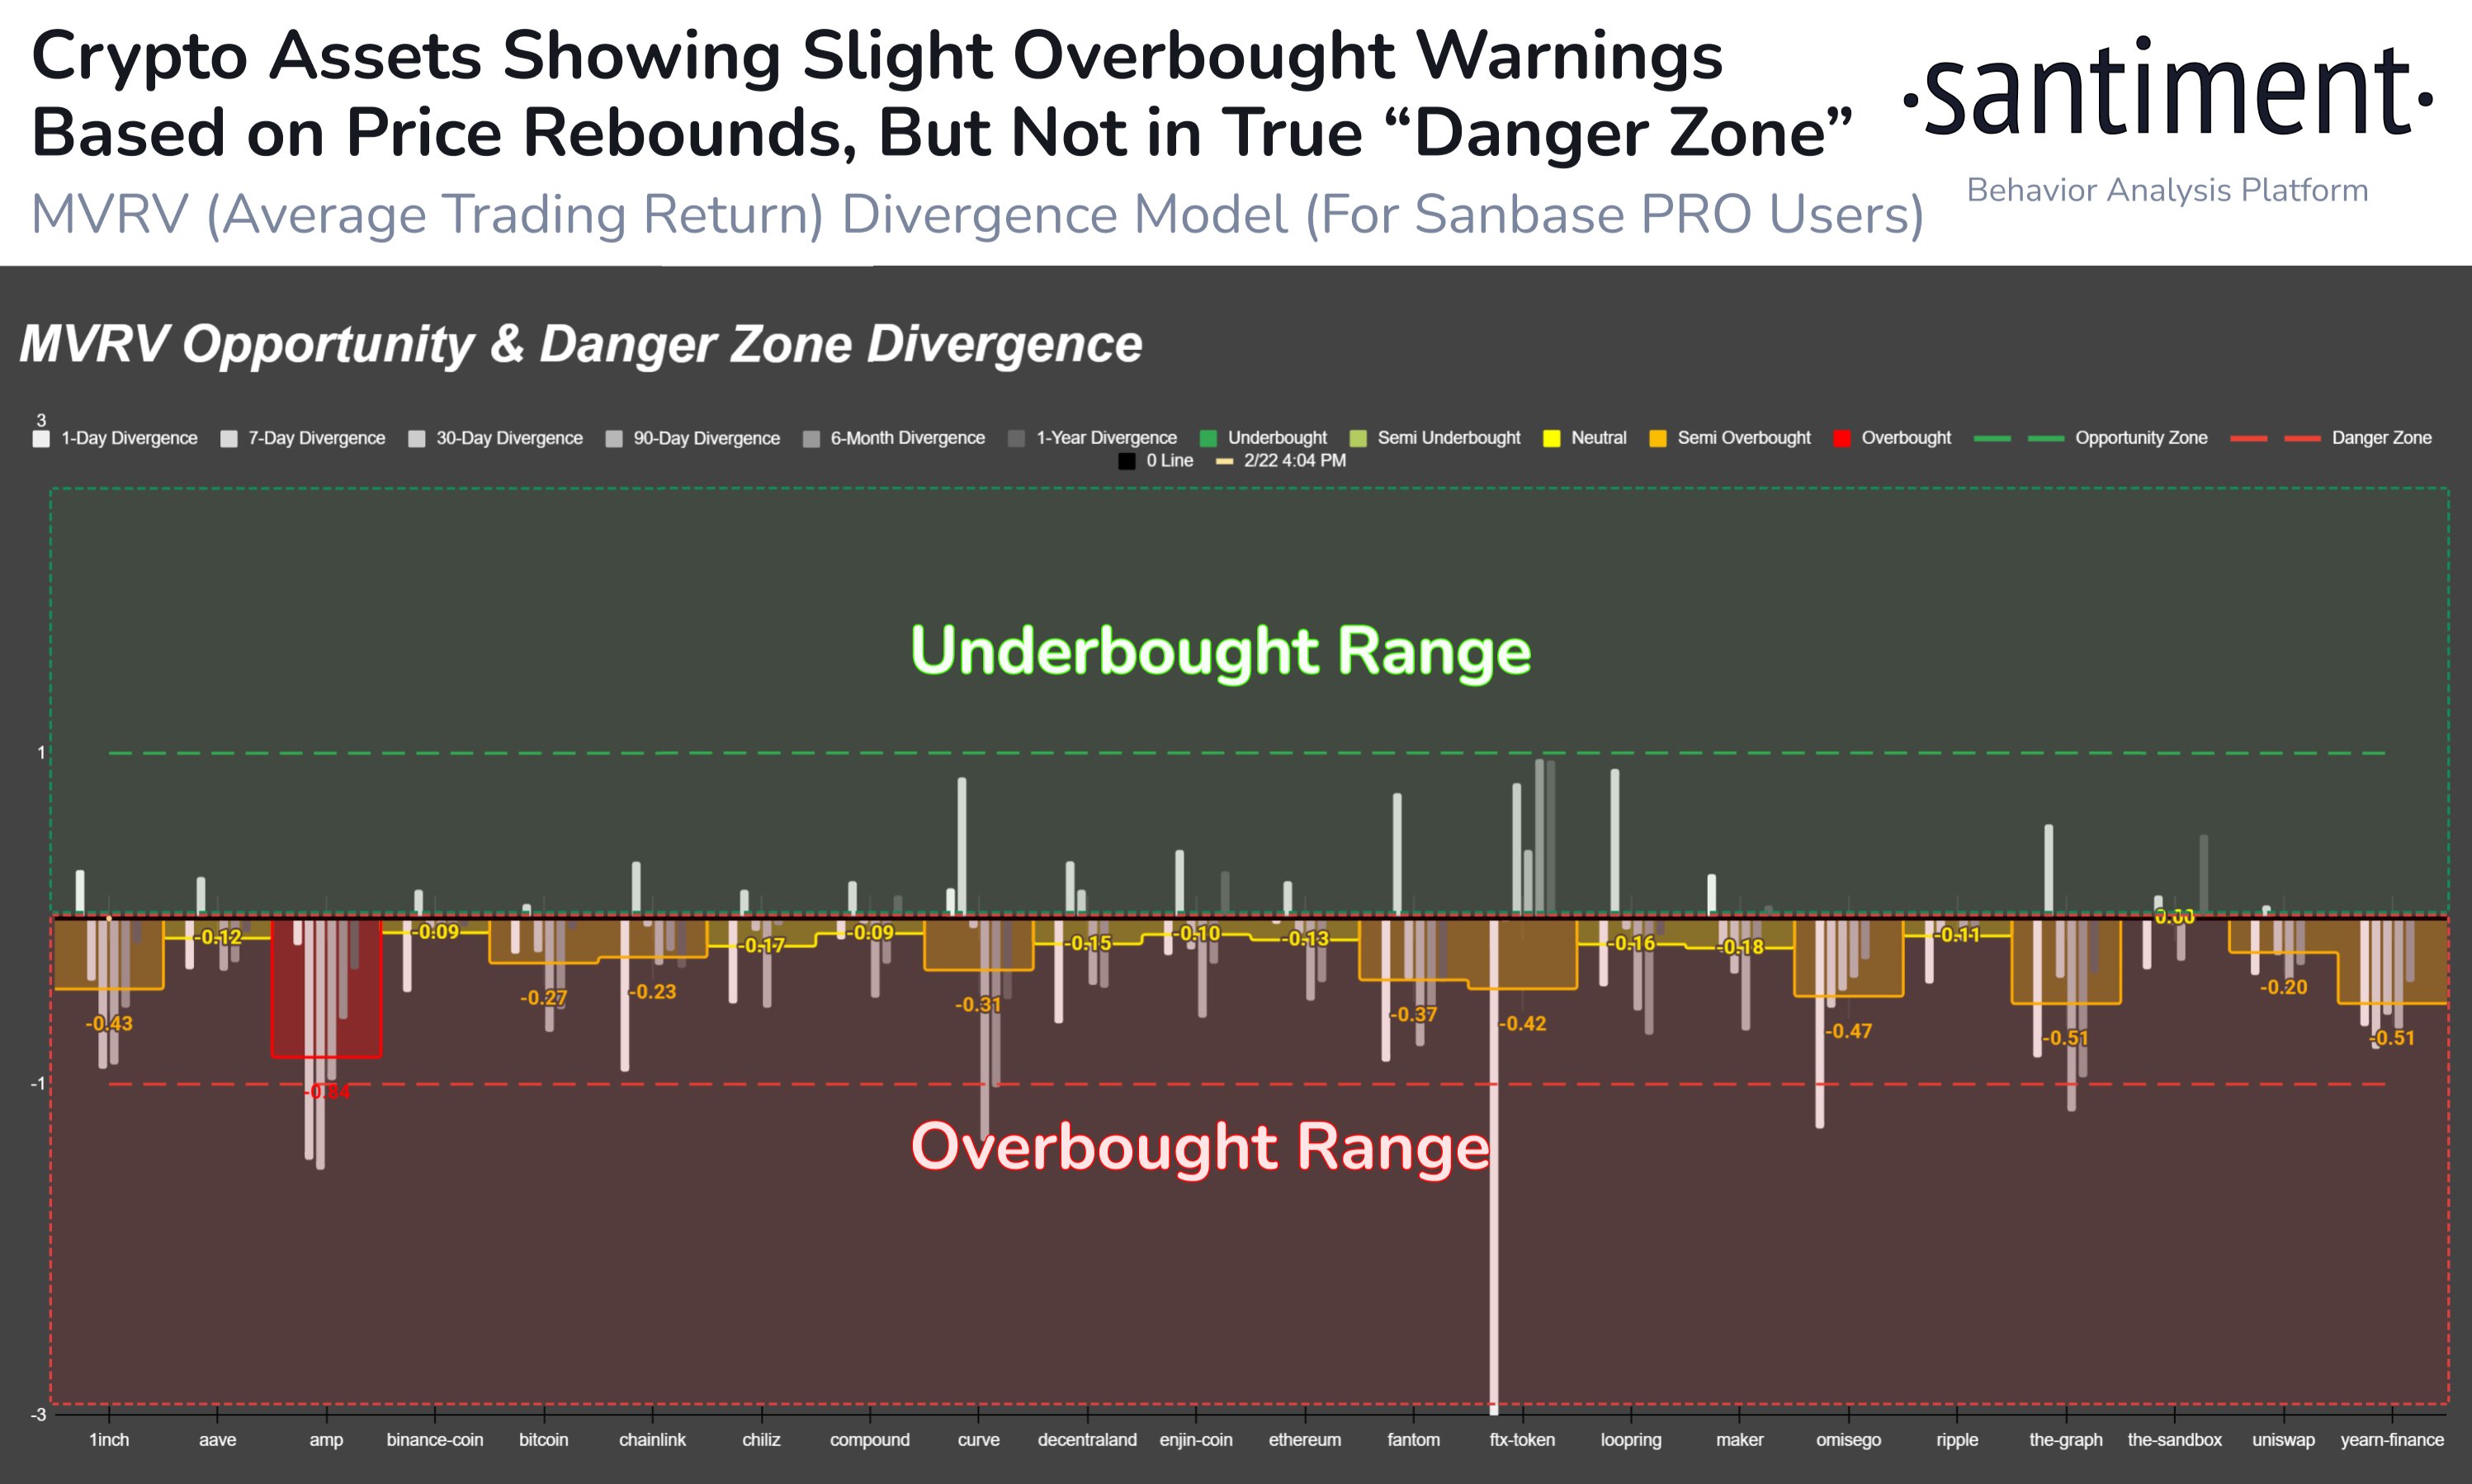
Looks like most of the values are in the negative right now | Source: Santiment on Twitter
As you can see in the graph above, assets are overbought when the MVRV deviation from the danger zone reaches -1. Likewise, the underbought state takes place at +1.
Note that this is reversed from how the MVRV ratio works (where values above 1 indicate overpriced zone). Santiment says the flipped polarity is intentional, as it makes things more intuitive.
From the chart, it is clear that all the cryptos in the market are in the negative zone on at least some of the time frames, which suggests that their prices are slightly overpriced right now.
However, most of the assets have yet to hit the danger zone, as the likes of Bitcoin, Ethereum and XRP have current MVRV divergence values of -0.27 or lower. This may mean that their prices may not be at too much risk of a correction at the moment.
Nevertheless, it still implies that the market as a whole is still carrying some profit at the moment. “Markets are most likely to move up when traders’ assets are underwater. At the moment, they are a bit over,” the research firm explains.
BTC price
At the time of writing, Bitcoin is trading around $24,300, down 1% in the last week.


The value of the asset seems to have been consolidating in the last few days | Source: BTCUSD on TradingView
Featured image from Kanchanara on Unsplash.com, Charts from TradingView.com, Santiment.net

