Bullish RSI divergence hints 10% relief Rally in Bitcoin price

Published 31 minutes ago
Today, the Bitcoin price is trading at the $19723 mark and had previously retested the weekly support at $19500. The long tail rejection attached to the daily candle by decreasing volume increases the likelihood of a bullish reversal. Can the potential bull run regain the $20600 mark?
Highlights from Bitcoin Price Analysis:
- The BTC buyers found significant support at $19550
- Bitcoin price action remained trapped in a narrow range
- The intraday trading volume in Bitcoin is $24.3 billion, indicating a loss of 13.5%.
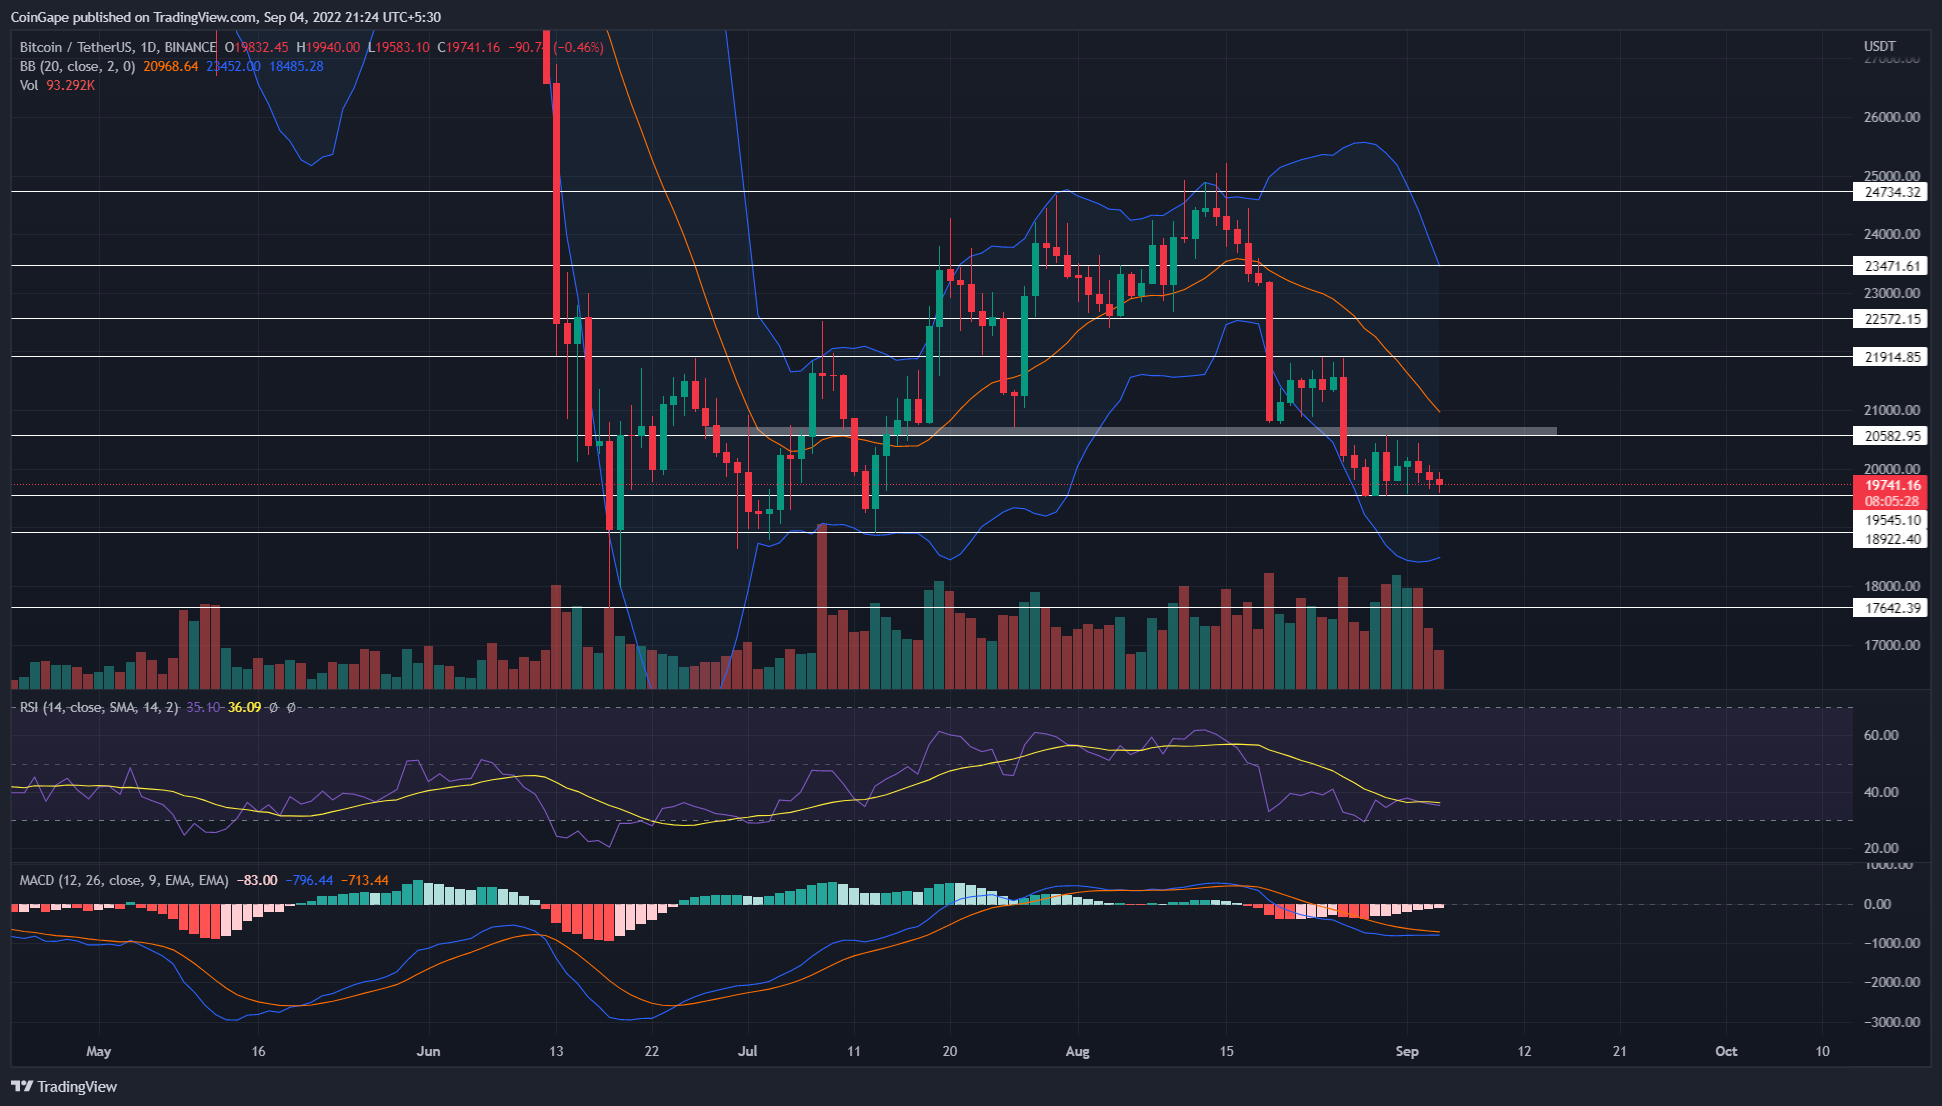 Source-Trading view
After the selloff in the second half of August, the Bitcoin price plunged to the $19,500 support and started a consolidation phase. This decline has offset around 75% of the gains recorded during the June to early August period, dropping prices by 22.5%.
Earlier this week, the Bitcoin price attempted to rally higher, but failed to surpass the nearest resistance at $20750. As a result, the coin price entered a narrow consolidation between $20750 and $19500.
Furthermore, the failed attempt mentioned above dropped the BTC price back to the $19500 mark. However, the declining volume during this bearish reversal reflects the weakening of the seller’s hand as we approach lower support.
Such volume activity with a far lower price rejection indicates a higher possibility of a bullish reversal. Thus, if the buyers pierce the $20750 resistance, the Bitcoin price may witness an extended relief rally before the bear trend continues.
A bullish reversal could boost prices by 10.5 or $14.5% to hit the resistance at $21900 or $22600 respectively. However, a bullish breakout above $22600 will weaken the bearish momentum and strengthen buyers for a $25000 breakout.
On the flip side, if the Bitcoin price took an immediate reversal from the $20750 resistance, the consolidation area would extend further and possibly break the lower support.
A break below $19500 will extend the correction phase to $18865 or $18000.
Technical indicator
Bollinger bands: coin price trading well below the midline reflects aggressive selling in the market. Moreover, a possible reversal may face dynamic resistance from this midline.
RSI indicator: A bullish divergence in daily RSI slope reinforces price reversal from $19500
MACD indicator: the fast and slow slopes drawn close to each other show the buyers’ attempt to regain trend control. A potential bullish crossover between these would encourage the $20750 breakout.
- Resistance level – $207501 and $22000
- Support level – $19550 and $18865
The content presented may include the author’s personal opinion and is subject to market conditions. Do market research before investing in cryptocurrencies. The author or publication has no responsibility for your personal financial loss.
Close history


