BTC/USD bounces back despite a strong US dollar
Bitcoin (BTC/USD) Talking Points:
Recommended by Tammy Da Costa
Get your free USD forecast
The recent FOMC interest rate decision rattled the markets after Fed Chairman Jerome Powell confirmed that the central bank will continue to raise key interest rates until inflation shows significant signs of easing. With Bitcoin prices rising to a weekly high of $20802 before the comment, a change in sentiment forced BTC/USD lower before finding support above $20000.
Currency traders can monitor central bank announcements viathe central bank’s calendar
Although the markets had already priced in a fourth interest rate increase of 75 bp in a row, the press conference that followed was not quite in line with the market’s expectations.
When Powell changed the Federal Reserve’s forecast to allow for further rate hikes over a longer period, higher yields and a stronger USD sent the S&P 500, Nasdaq and Dow Jones plummeting. However, unlike historic rallies that once sent Bitcoin into a tailspin, the major cryptocurrency has recently failed to replicate the moves seen in the stock market.
Bitcoin (BTC/USD) Price Action
After a temporary retest of $20039, BTC/USD was quick to bounce back, bringing prices into the same mundane range. While the macro-fundamental backdrop continues to threaten demand for speculative assets, a breach of the broader support-resistance zone between $18,000 and $22,000 is still needed to drive price action anyway.
Recommended by Tammy Da Costa
Range Trading Basics
Bitcoin (BTC/USD) Daily Chart
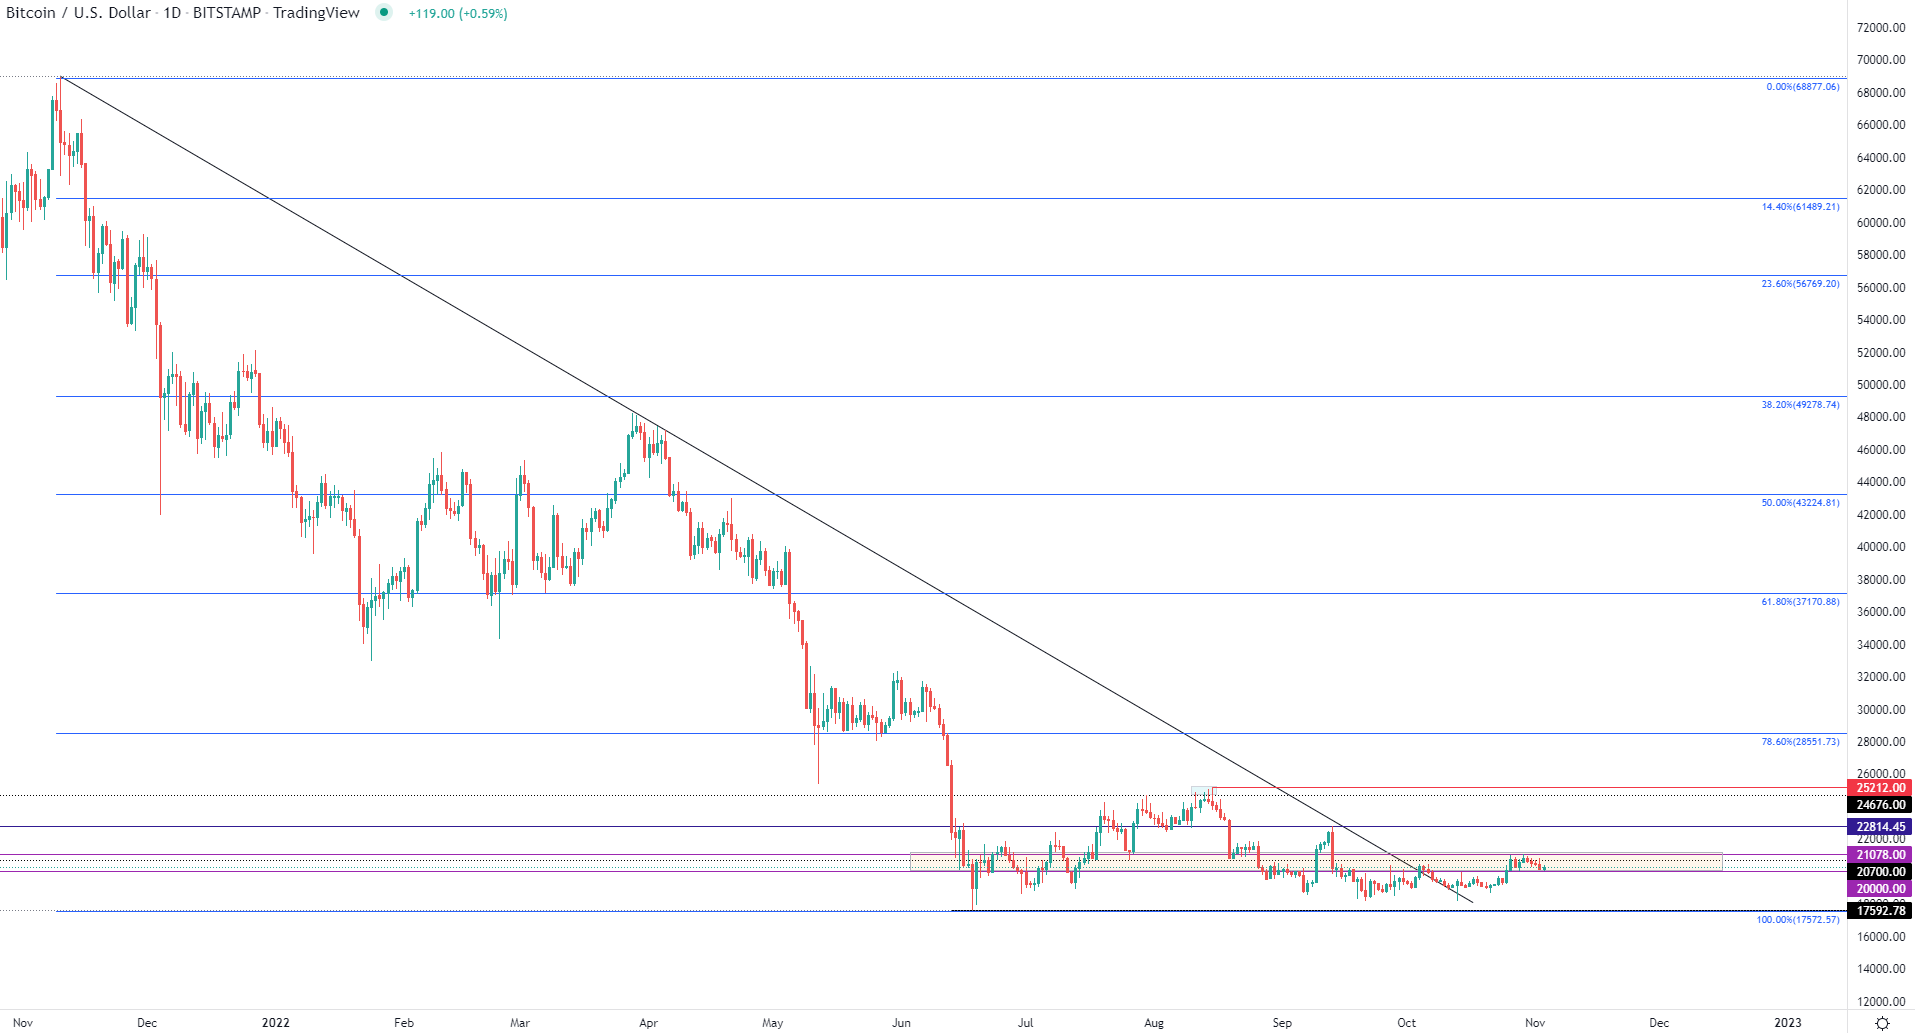
Chart prepared by Tammy DaCosta using TradingView
With the October high now holding as imminent resistance at $21078, a new layer of horizontal support has formed around the $20500 mark. While technical and psychological levels help establish firm levels of support and resistance, a clear breach of the above levels may be necessary for either bulls or bears to gain momentum. If prices fall below $20,000, the next support zone remains at the December 2017 high of $19666, with a break below bringing the September low back into focus at $18157, which could allow for bearish continuation and a potential retest of the June low of approx. $17592.
Trade smarter – Sign up for the DailyFX newsletter
Receive timely and compelling market commentary from the DailyFX team
subscribe to newsletter
— Posted by Tammy Da Costa, Analyst for DailyFX.com
Contact and follow Tammy on Twitter: @Tams707


