Bitcoin Stablecoin Supply Ratio Approaching a “Buy” Signal
On-chain data shows that the recent trend in the Bitcoin Stablecoin Supply Ratio may indicate that the crypto may soon see a buy signal.
Bitcoin Stablecoin Supply Ratio RSI 14 is close to a “buy” signal
As explained by an analyst in a CryptoQuant post, when the SSR RSI has gone below a value of 25 over the past few years, the crypto has observed a buy signal.
“Stablecoin Supply Ratio” (or SSR for short) is an indicator that measures the ratio between the market value of Bitcoin and that of all stablecoins.
As the name implies, “stablecoins” are quite stable in their value, as they are usually tied to fiat currencies. Because of this, investors in the crypto market move the coins into them at times when they want to escape the volatile markets.
This can build up a reserve in the form of stablecoins that can be easily distributed to cryptos like Bitcoin when investors feel the prices are right to jump back in.
When the value of SSR is low, it means that the stablecoin market cap is high right now. This suggests that there is a large amount of stablecoins currently piling up, which could act as buying pressure for cryptos like Bitcoin, and thus could be bearish for their prices.
On the other hand, the SSR that is high may suggest that the Stablecoin market value is lower compared to the BTC at the moment. Such a trend suggests that there is not much dry powder to support other coins and therefore can either be neutral or bearish on their prices.
Now, here is a chart showing the trend of the SSR RSI 14 over the past couple of years:
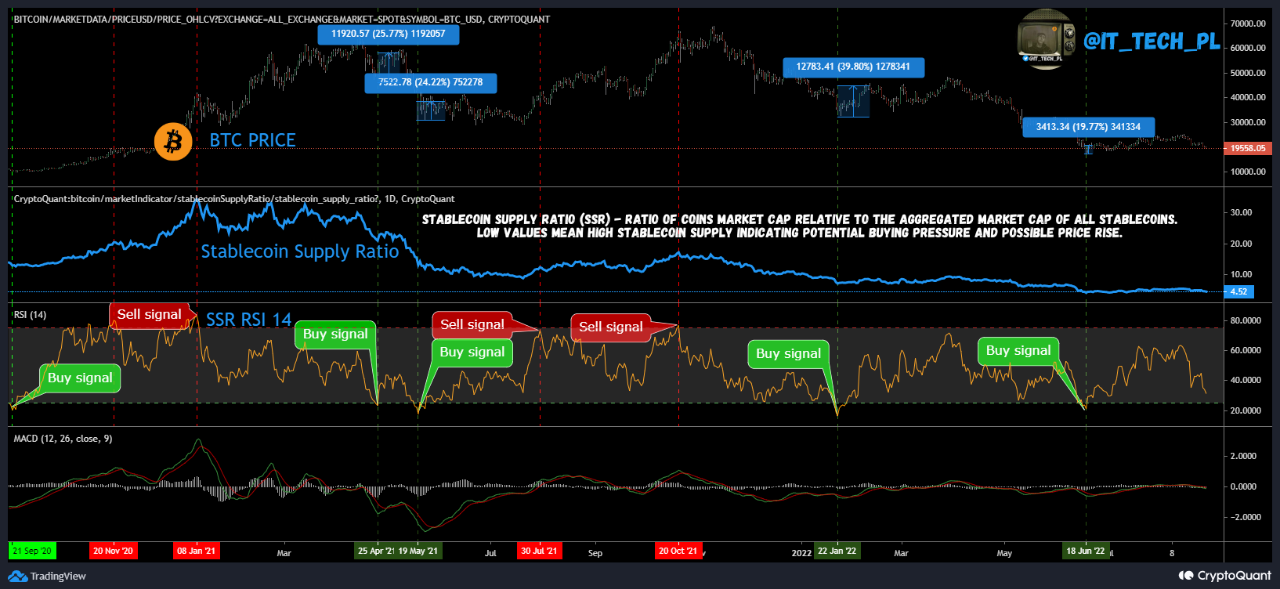
The value of the metric seems to have been going down recently | Source: CryptoQuant
The “Relative Strength Index” (RSI) records the rate of change in any quantity, which in this case is the Bitcoin SSR. In the graph above, the quant has marked the relevant trend zones for this indicator.
It seems that when the SSR RSI 14 has reached values above 75, the price of the crypto has observed a sell signal. While the metric reaches values lower than 25, it has instead acted as a buy signal.
Recently, the indicator’s value has decreased and is now close to the 25 threshold. However, the buy signal has not fully formed yet, so it remains to be seen whether the calculation continues this trend and breaks the 25 level or not.
BTC price
At the time of writing, Bitcoin’s price is hovering around $19.7k, down 7% in the last week.

Looks like the crypto's value has gone down | Source: BTCUSD on TradingView
Featured image from Aleksi Räisä on Unsplash.com, charts from TradingView.com, CryptoQuant.com


