Bitcoin Puell Multiple Retests Downtrend Line, Will It Break Over This Time?
On-chain data shows that the Bitcoin Puell Multiple is currently retesting the downtrend line, will the metric be able to break above it this time?
The Bitcoin Puell Multiple has gone up a bit over the past few days
As pointed out by an analyst in a CryptoQuant post, a trend reversal may be approaching in the BTC market.
The “Puell Multiple” is an indicator that measures the ratio of the current daily Bitcoin mining earnings (in USD) to the 365-day moving average of the same.
What this calculation tells us is how much the BTC miners are earning right now compared to the average over the past year.
When the value of the multiple is greater than 1, it means that miners are collecting more profit compared to the average of the last 365 days.
On the other hand, values below the threshold suggest that miners are under pressure right now as their earnings are lower than last year’s average.
Historically, the crypto has tended to form cyclical bottoms whenever the indicator has fallen below the 0.5 mark.
Now, here is a chart showing the trend of the Bitcoin Puell Multiple over the last few years:
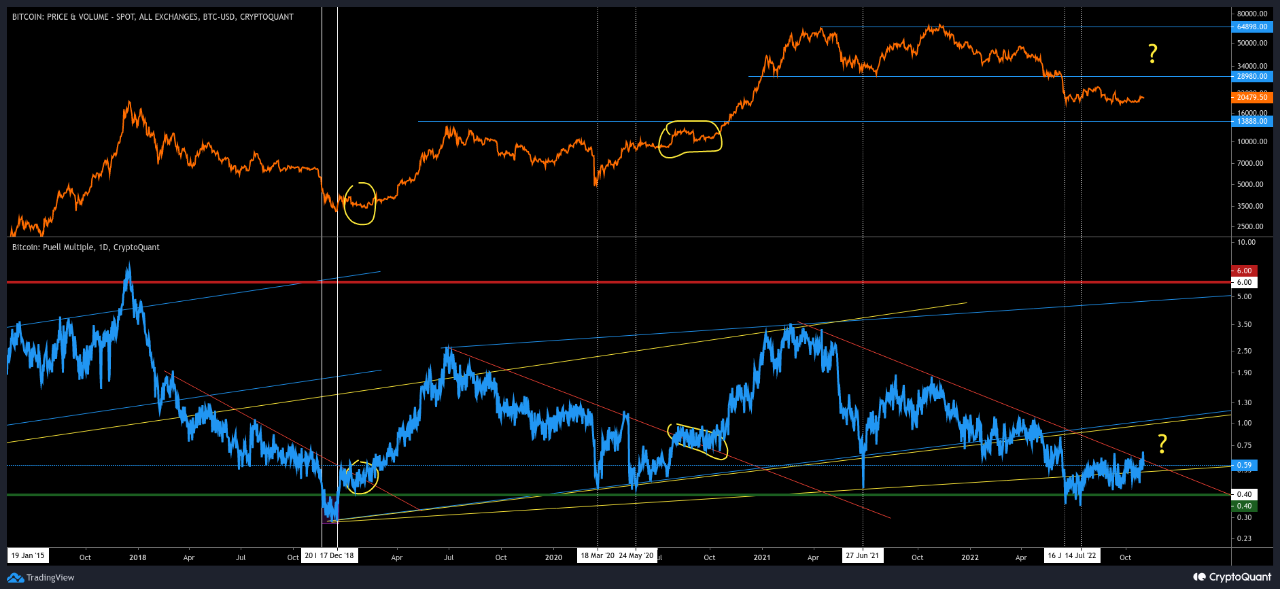
The value of the metric seems to have been slightly going up recently | Source: CryptoQuant
As you can see in the graph above, the Bitcoin Puell multiple dipped a few months back and entered the historical buy zone.
Since then, the indicator has been on a gradual upward trajectory, and is now retesting the “downtrend” line.
This downtrend line has provided resistance to the metric since about a year ago. In the diagram, the quant has also marked how the trend was previously when the indicator was on a downward trend.
It looks like the Bitcoin Puell Multiple found rejection multiple times from a similar downtrend line during both the 2018-19 bear and the 2020 COVID crash.
After forming the bottom in these two periods, the metric finally broke through the line and a bullish trend followed in the price of the crypto.
The analyst notes that this is now the third time the Puell Multiple is retesting this level under the current bear, so it’s possible it could break through it this time.
If the historical trend is anything to go by, the indicator breaking the line now could lead to a bullish reversal for Bitcoin.
BTC price
At the time of writing, Bitcoin’s price is hovering around $20.1k, down 3% in the last week.

Looks like BTC has been going downhill | Source: BTCUSD on TradingView
Featured image from Maxim Hopman on Unsplash.com, charts from TradingView.com, CryptoQuant.com


