Bitcoin Price Recovery; Vital levels to monitor
Bitcoin price bounced off the $15,400 price level and staged a recovery in the last day. Over the past 24 hours, BTC has moved sideways after claiming the $16,000 price mark.
Since the coin trades sideways the moment after its mining, Bitcoin is waiting for a breakout. The coin needs to move above the $16,600 mark for the bears to be invalidated.
Now that Bitcoin is closer to the aforementioned price resistance mark, there may be a chance for BTC to move to the $17,000 price zone.
Buyers need to step up for the coin to move above the $16,600 price mark. The coin’s technical outlook confirms that it is trending upwards on the chart.
However, buying power has remained low despite a rally on the one-day chart.
Bitcoin Price Analysis: One Day Chart
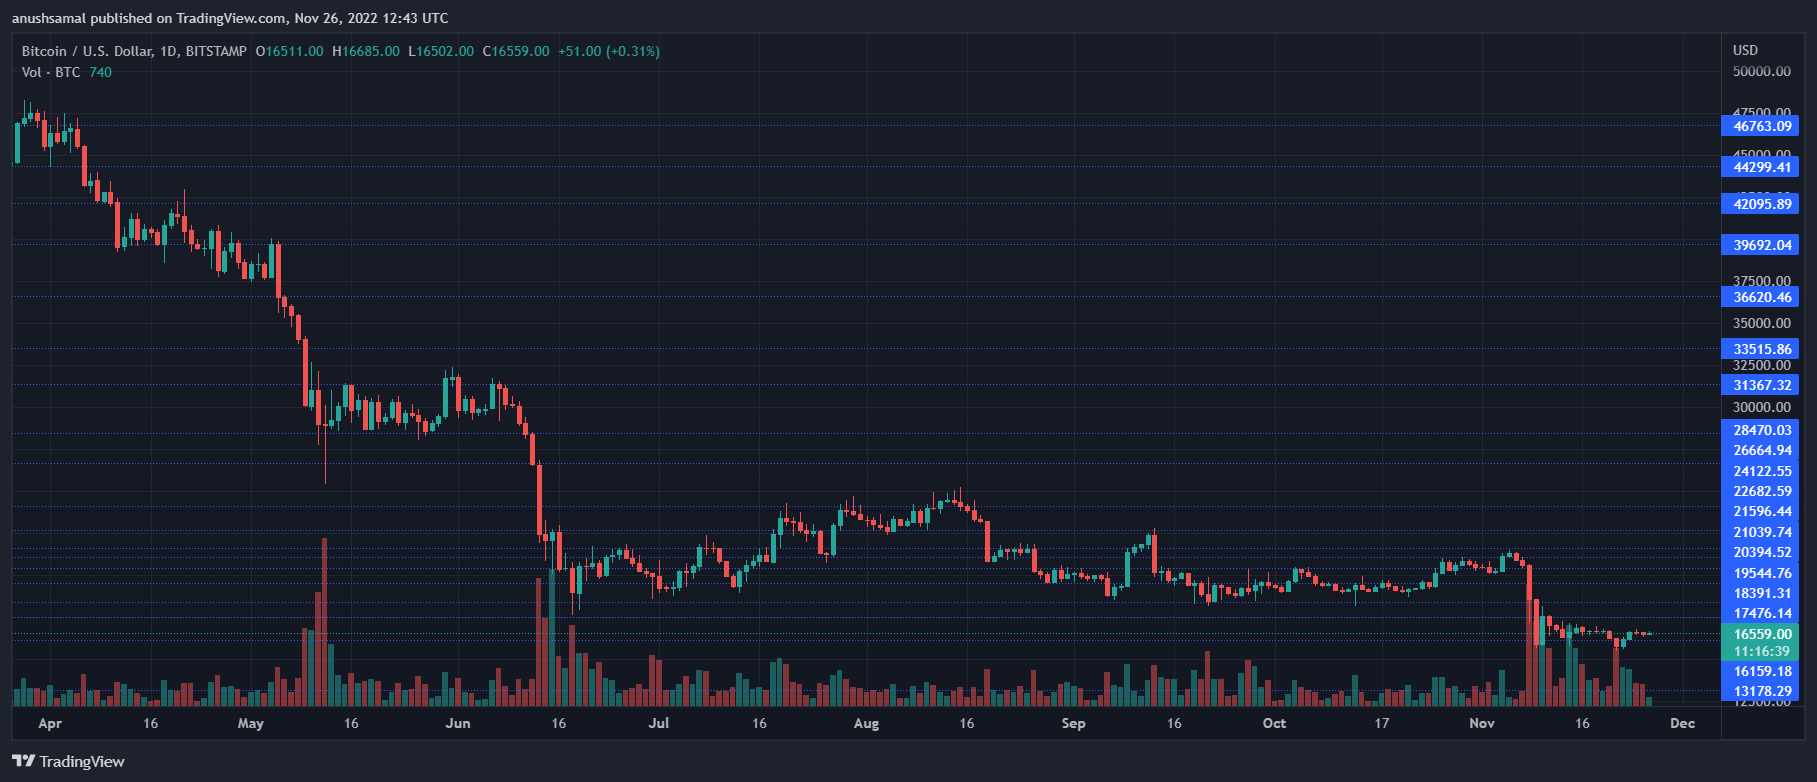
BTC was trading at $16,500 at the time of writing. After Bitcoin broke past the $15,400 price level, the coin registered a positive buying action. This has contributed to the coin’s price rising above the $16,000 mark. The decisive price zone remains at $16,500 and a move above it will be a point of bullish momentum for Bitcoin.
BTC’s overhead resistance was at $17,000 and a move above it could stop bulls at $17,600. BTC will reach a psychological level of $18,000 if it rises above $17,600. The amount of BTC traded in the previous session was green, indicating accumulation.
Technical analysis
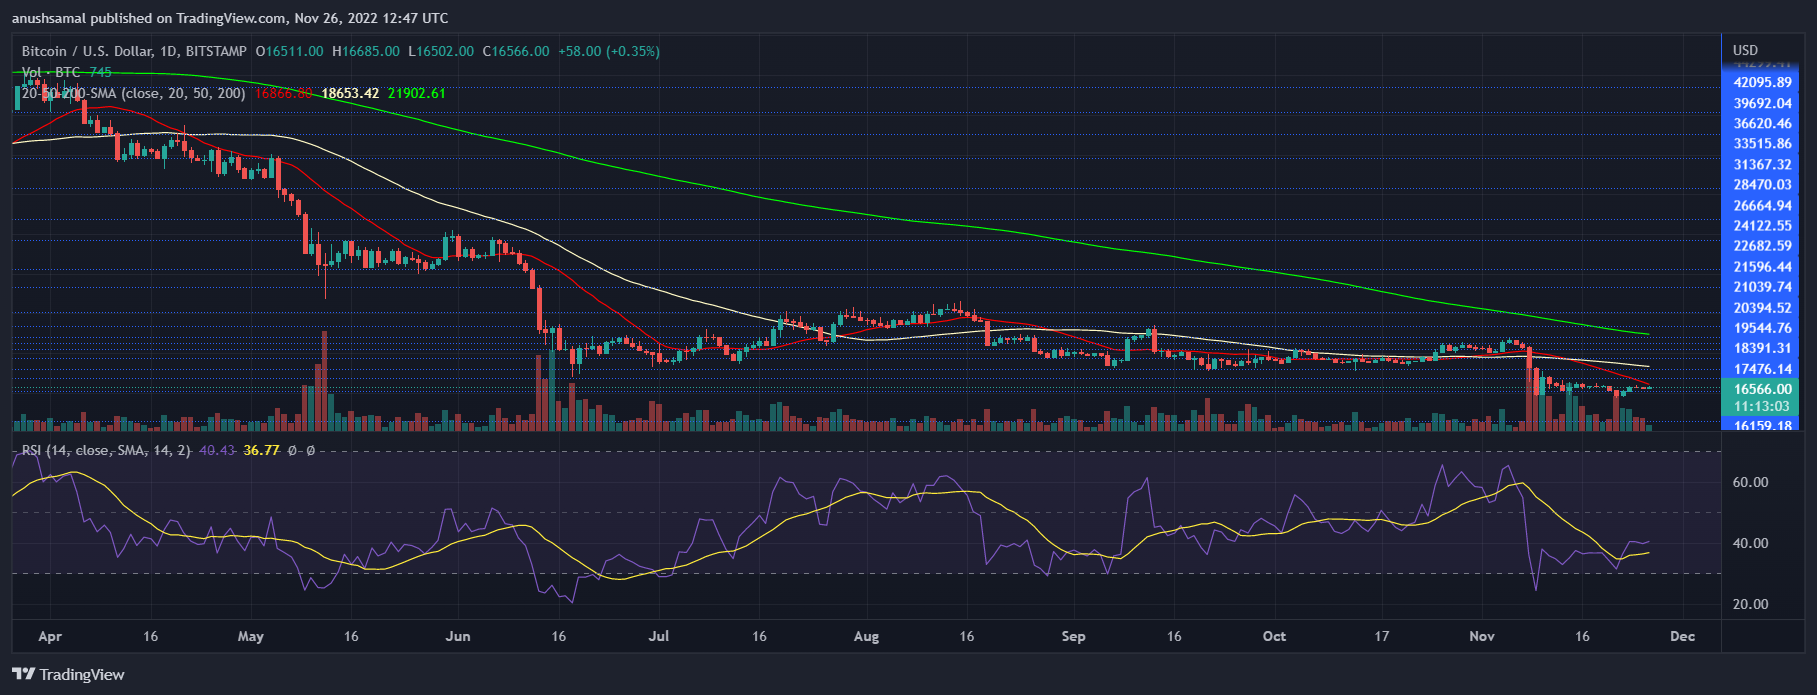
The coin had recently visited the oversold zone in the middle of this month and the move above the $15,400 mark had prompted buyers to regain confidence in the asset.
At the time of writing, BTC registered demand on the one-day chart. The Relative Strength Index moved above the 40 mark as demand for the coin returned to the market.
If demand remains consistent, a move above $17,000 will occur during the next trading session. Bitcoin could jump above the 20-Simple Moving Average if the coin crosses the $16,700 price mark.
Currently, BTC was below the 20-SMA. This indicated that sellers were still driving price momentum in the market.
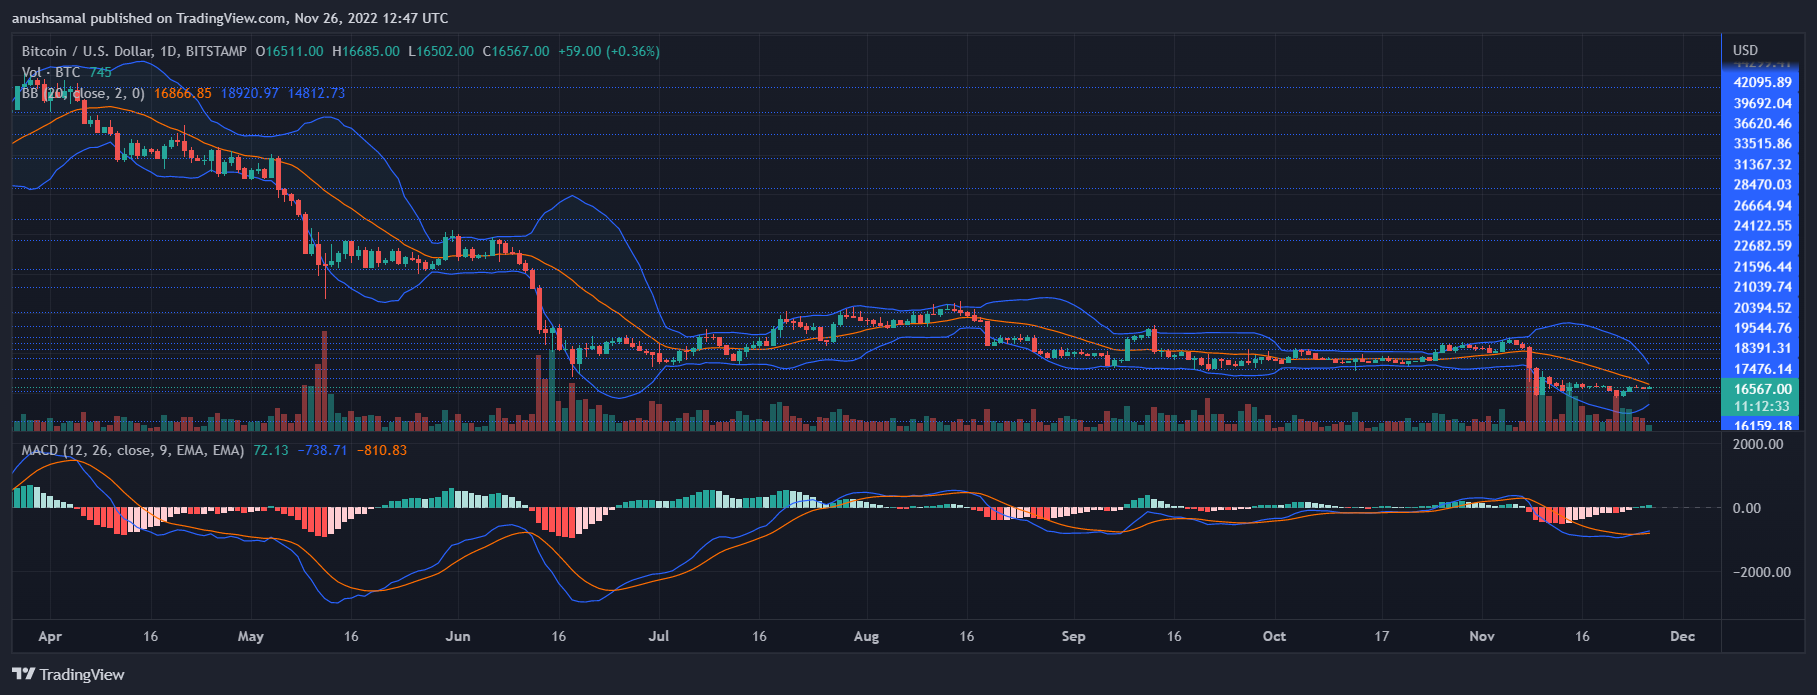
In line with the buying strength, BTC also depicted the start of the buy signal for the coin. Moving Average Convergence Divergence indicates price momentum and trend change.
MACD showed green signal bars, which is associated with the buy signal for BTC. In anticipation of ranged movements, the Bollinger Bands, which indicate price fluctuations, were reduced.
An increase in demand will help bulls gain strength and break past the current trading range.
Featured Image From UnSplash, Charts From TradingView


