Bitcoin price needs to hover above these 2 levels to gain momentum
Bitcoin continues to face strong resistance at the $17,000 price ceiling. Over the past 24 hours, Bitcoin has lost 2% of its market value. For the past week, BTC has hovered around the same price region. The King Coin has not touched the $17,000 resistance band in more than two weeks.
Currently, Bitcoin has a bearish bias. The technical outlook pointed to purchasing power losing momentum. However, it is too early to predict when BTC will bottom out, which could mean that this consolidation phase will be prolonged.
The price of Bitcoin has been extremely volatile throughout November. BTC witnessed a drop from $21,000 to $15,500 during the first week of this month. The coin had revisited these lows in the past week. After touching the lows again, BTC regained some of its lost value and traded at $16,500. BTC has yet to break two key price levels for the bulls to take charge in the market.
Bitcoin Price Analysis: One Day Chart
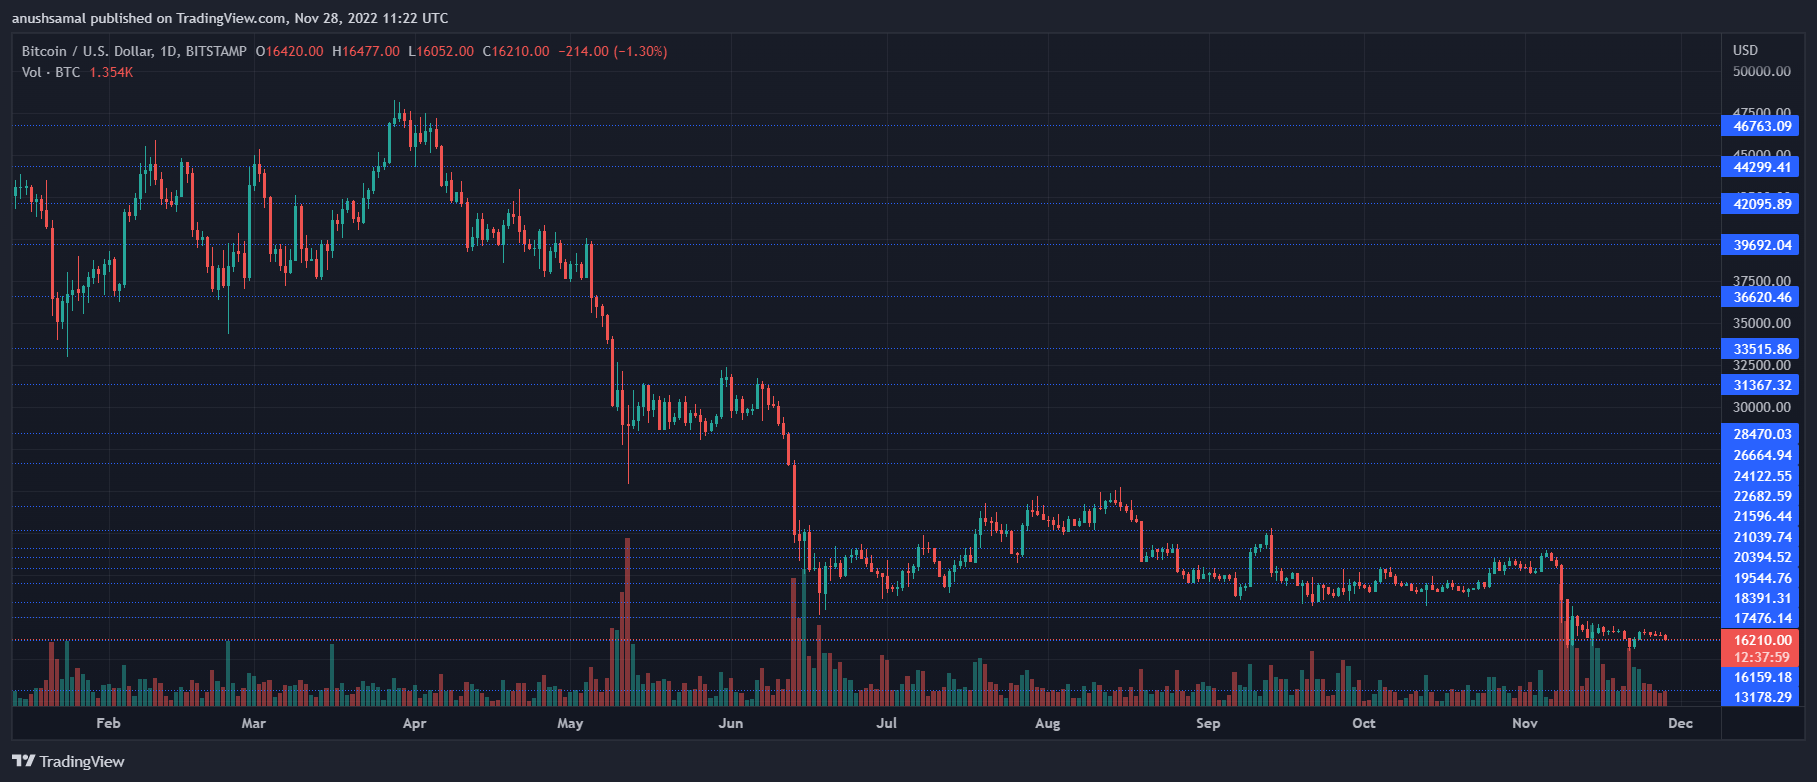
BTC was trading at $16,200 at the time of writing. The bulls have tried to break past $17k, but have been rebuffed each time. The constant rejection has stopped the further upward movement of the coin as it rose from $15,500 to $16,800.
The immediate resistance mark for Bitcoin remained at $16,600. In a shorter time frame, Bitcoin has formed a narrowing pattern. If Bitcoin continues to face rejection at the $17,000 mark, it will fall through the $15,500 level and trade near the $14,000 price. The two important levels for Bitcoin stand at $16,600 and $17,000 respectively.
Technical analysis
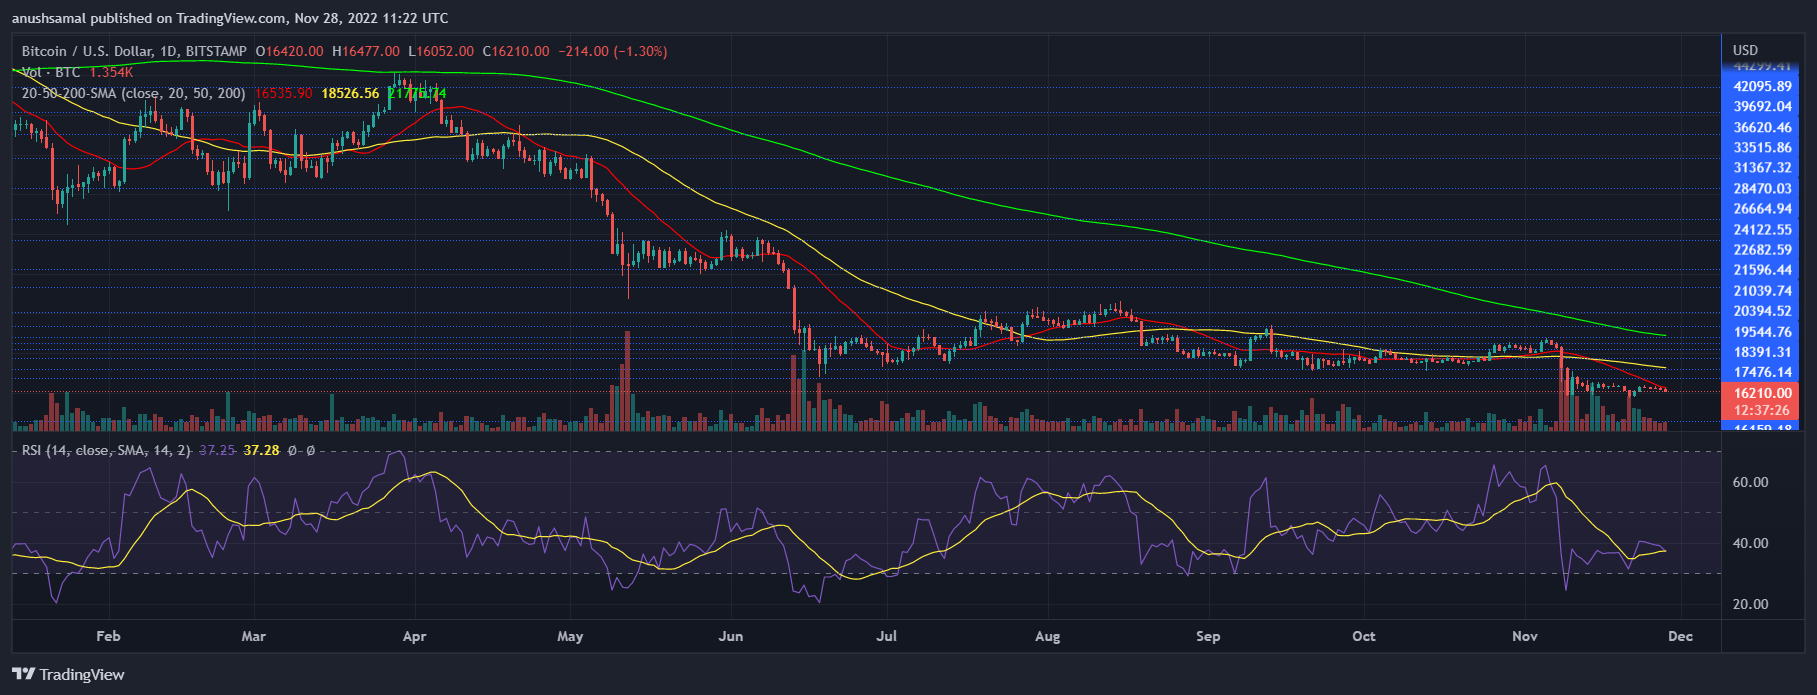
BTC has depicted a fall in buyers on the daily chart. The relative strength index was below the 40 mark, indicating that the coin was in the grip of the bears. It indicated that sellers outnumbered buyers.
Bitcoin price was below the 20-Simple Moving Average, which highlighted selling strength and showed that sellers were driving price momentum in the market. If BTC breaks the $17,000 level, it is still important for the coin to trade above the $17,200 level; If you don’t, the price action can quickly reverse.
BTC has slowly started to form a buy signal on its one-day chart. This indicates that Bitcoin may try to regain the $17,000 mark if buyers act on it.
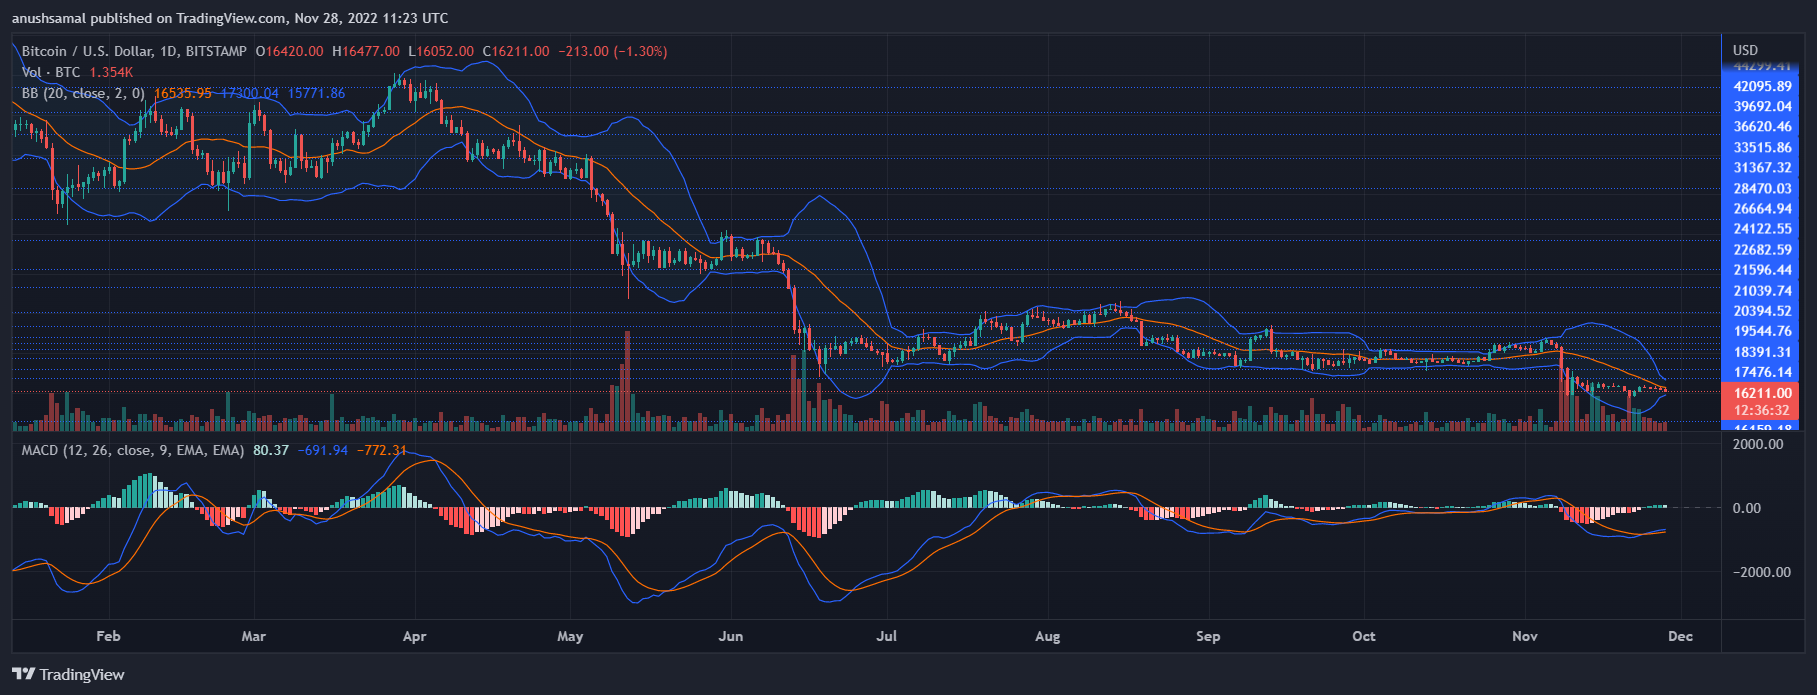
Moving Average Convergence Divergence underwent a bullish crossover and formed green signal bars corresponding to the buy signal. Bollinger Bands depict price swings and volatility, the bands were narrowed in anticipation of further narrowing of price movements in the shorter time frame.
Featured image from Unsplash, Chart: TradingView.com

