Bitcoin price is stuck in the key area, what could lead to another increase
Bitcoin price remains well below the $23,650 resistance. BTC could gain bullish momentum if it is able to clear the $24,000 resistance.
- Bitcoin is still struggling to make a move above the $23,600 resistance zone.
- The price is trading above $23,300 and the 100 hourly simple moving average.
- A short-term descending channel is forming with resistance near $23,450 on the hourly chart of the BTC/USD pair (data feed from Kraken).
- The pair may gain momentum if it clears the $23,650 and $24,000 resistance levels.
Bitcoin price faces resistance
Bitcoin price failed to clear the $23,650 resistance zone and started another decline. BTC traded below the $23,200 level, but the bulls were active near the $23,000 zone.
A low was formed near $23,042 and the price is now correcting higher. There was a move above the $23,250 resistance zone. The price climbed and tested the 50% Fib retracement level of the recent decline from the $23,885 swing high to $23,042 low.
Bitcoin price is now trading above $23,300 and the 100 hourly simple moving average. A short-term descending channel is also forming with resistance near $23,450 on the hourly chart of the BTC/USD pair.
An immediate resistance is near the $23,450 zone. The first major resistance is near the $23,650 zone. It is also near the 76.4% Fib retracement level of the recent decline from the $23,885 swing high to $23,042 low. A clear move above the $23,650 resistance could initiate a decent rally towards the $24,000 resistance zone.
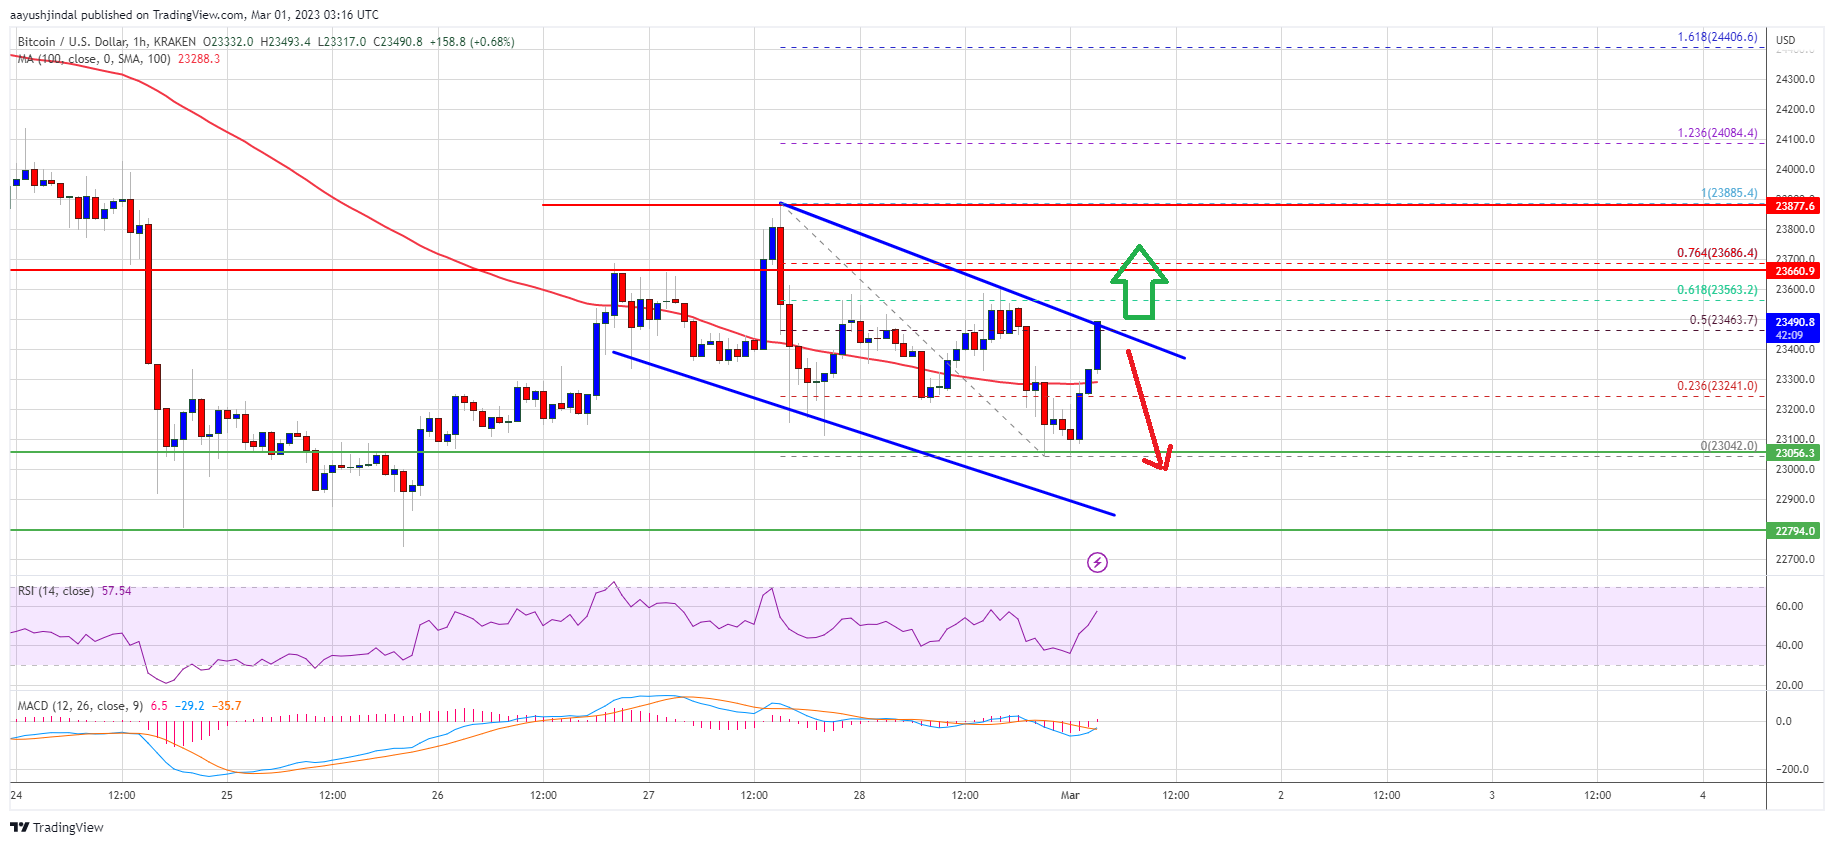

Source: BTCUSD on TradingView.com
The next key resistance is near the $24,400 zone. A close above the $24,400 resistance could push the price into a bullish zone. In the aforementioned case, the price might rise towards the $25,200 resistance.
New decline in BTC?
If the bitcoin price fails to clear the $23,650 resistance, it could start another decline. An immediate support on the downside is near the $23,250 zone.
The next major support is near the $23,000 zone. The main support is at $22,800, below this there is a risk of a move towards $22,200. The next major support is near the $22,000 level.
Technical indicators:
Hourly MACD – MACD is now losing momentum in the bearish zone.
Hourly RSI (Relative Strength Index) – RSI for BTC/USD is now above the 50 level.
Major support levels – $23,200, followed by $22,800.
Major resistance levels – $23,650, $24,000 and $24,600.


