Bitcoin price is resisting, but breaking this resistance could encourage bulls
Bitcoin price is struggling to clear the $17,000 resistance zone. BTC needs to stay above $16,000 to avoid further losses in the short term.
- Bitcoin is still consolidating above the $16,350 and $16,000 support levels.
- The price is trading just above $16,500 and the 100 hourly simple moving average.
- A major bearish trend line is forming with resistance near $16,750 on the hourly chart of the BTC/USD pair (data feed from Kraken).
- The pair could start a recovery wave if it clears the $17,000 resistance zone.
Bitcoin price faces resistance
Bitcoin price made an attempt to gain strength above the $17,000 resistance zone. However, BTC struggled to hold steady above the $17,000 level.
The price traded as high as $17,098 and recently started a slow decline. There was a move below the $16,800 and $16,650 levels. The price fell below the 23.6% Fib retracement level of the upward move from the $15,833 swing to the $17,098 high.
The price even rose below the $16,500 level. However, the bulls were active near the 50% Fib retracement level of the upward move from the $15,833 swing low to the $17,098 high.
Bitcoin price is now trading just above $16,500 and the 100 hourly simple moving average. On the upside, an immediate resistance is near the $16,750 level. There is also a major bearish trend line forming with resistance near $16,750 on the hourly chart of the BTC/USD pair.
The first major resistance is near the $17,000 zone. A clear move above the $17,000 resistance could set the pace for a decent recovery wave.
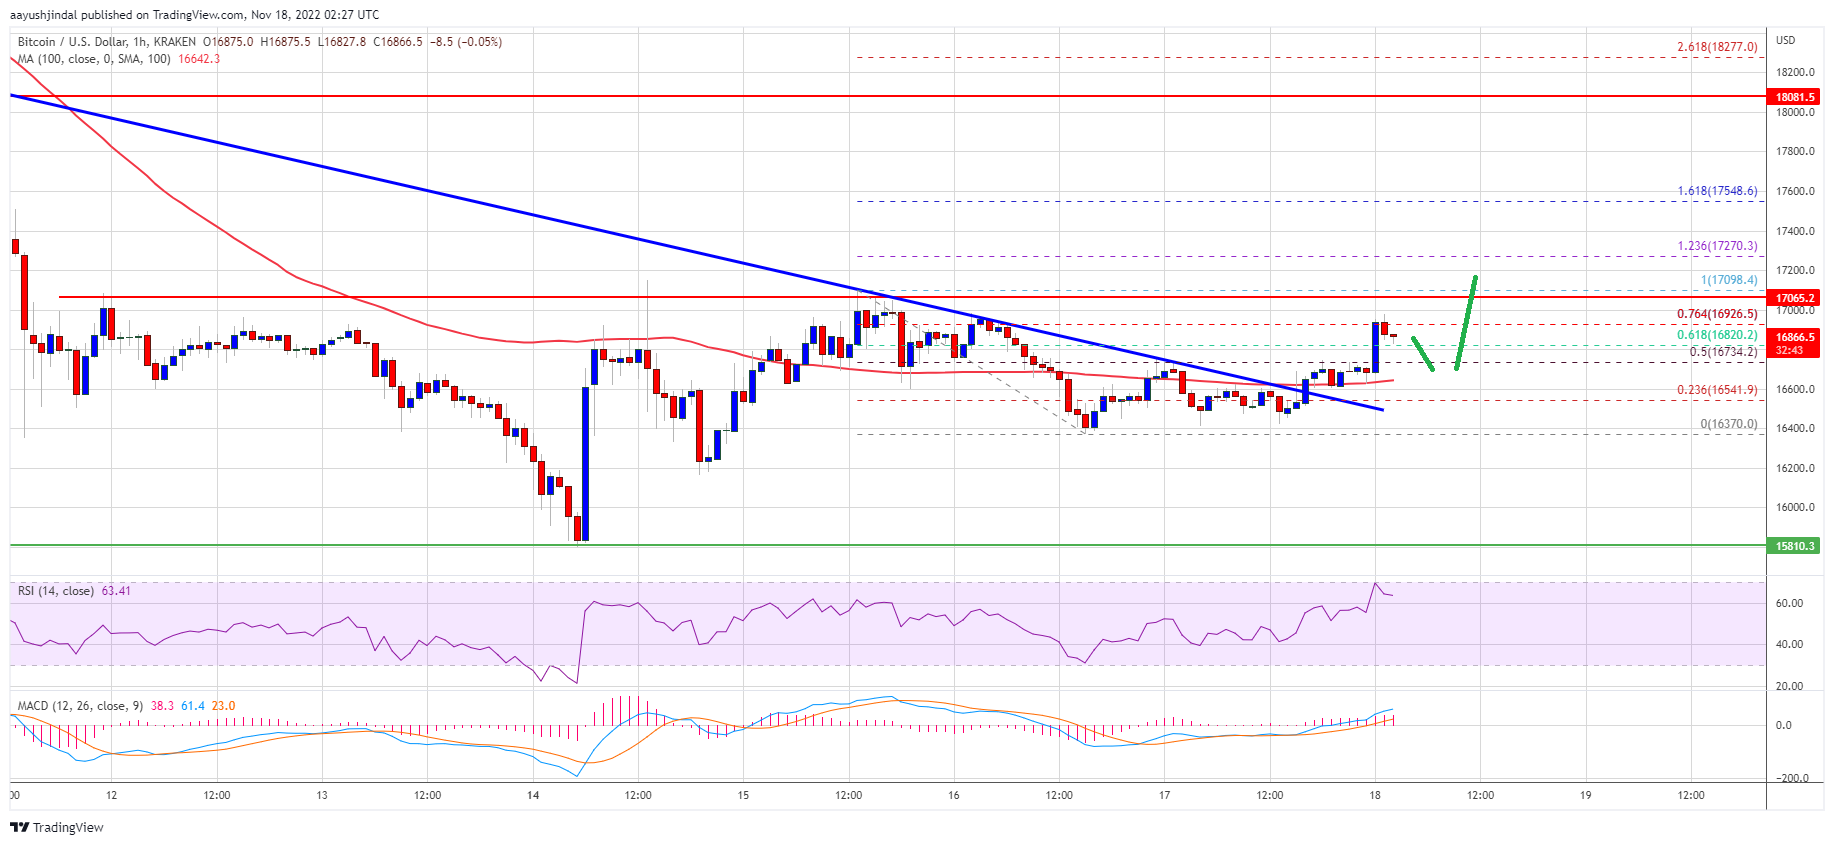
Source: BTCUSD on TradingView.com
The next major resistance is near $17,500, above which the price could rise towards the $18,000 zone. Any further gains could send the price towards the $18,500 resistance zone.
New decline in BTC?
If bitcoin fails to gain momentum above the $17,000 resistance zone, it may continue to move lower. An immediate support on the downside is near the $16,600 level and the 100 hour SMA.
The next major support is near the $16,350 zone. The main support is near the $16,000 zone. A clear move below the $16,000 support could trigger another major decline in the near term.
Technical indicators:
Hourly MACD – MACD is now picking up speed in the bullish zone.
Hourly RSI (Relative Strength Index) – RSI for BTC/USD is now above the 50 level.
Major support levels – $16,350, followed by $16,000.
Major resistance levels – $16,750, $17,000 and $17,500.


