Bitcoin price is going down, why the bears are not done yet
Bitcoin price is slowly moving down towards $15,500. BTC is still at risk of more losses unless it breaks above the $17,000 resistance zone.
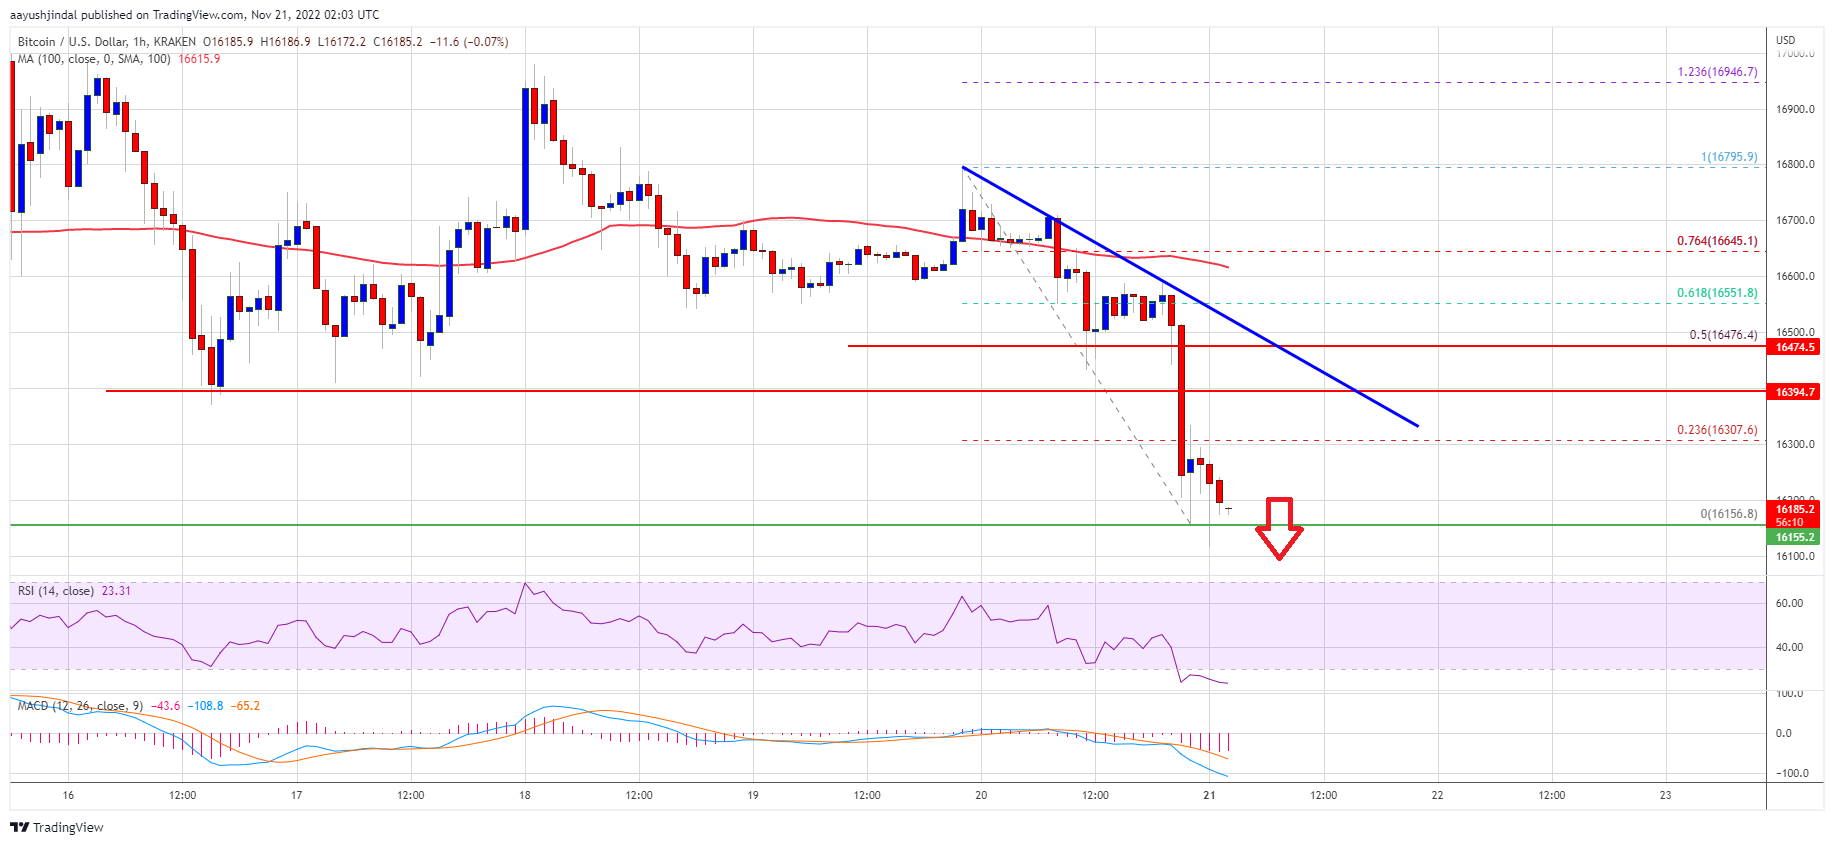
- Bitcoin started another decline below the $16,500 and $16,400 levels.
- The price is trading below $16,500 and the 100 hourly simple moving average.
- An important bearish trend line is forming with resistance near $16,390 on the hourly chart of the BTC/USD pair (data feed from Kraken).
- The pair could start a decent rally if there is a move above the $16,500 resistance zone.
Bitcoin price restart decline
Bitcoin price failed to gain momentum above the $17,000 resistance. BTC struggled to hold above the $16,650 level and started another decline.
The last swing high was formed near $16,795 before the price fell below the $16,500 support. It was a close below the $16,500 zone and the 100-hour simple moving average. The bears even pushed the price towards the $16,150 level.
A low is forming near $16,156 and the price is now consolidating losses. On the upside, an immediate resistance is near the $16,300 level. It is near the 23.6% Fib retracement level of the recent decline from the $16,795 swing high to $16,156 low.
The first major resistance is near the $16,400 zone. There is also an important bearish trend line forming with resistance near $16,390 on the hourly chart of the BTC/USD pair. The next major resistance is near the $16,500 level. It is near the 50% Fib retracement level of the recent decline from the $16,795 swing high to $16,156 low.
Source: BTCUSD on TradingView.com
Bitcoin price needs to clear the trendline resistance and then the 100-hour simple moving average to move into a positive zone. The next major resistance is near $17,000, above which the price could pick up the pace for a move towards the $18,000 zone.
More losses in BTC?
If bitcoin fails to gain momentum above the $16,400 resistance zone, it may continue to move lower. An immediate support on the downside is near the $16,150 level.
The next major support is near the $16,000 zone, below which the price may test the key support at $15,500. A clear move below the $15,500 support could send the price further lower.
Technical indicators:
Hourly MACD – MACD is now picking up speed in the bearish zone.
Hourly RSI (Relative Strength Index) – RSI for BTC/USD is now in oversold zone.
Major support levels – $16,150, followed by $16,000.
Major resistance levels – $16,350, $16,400 and $16,500.

 Resolution in Reintroduced Bill: Report")
