Bitcoin price forms a key trend and quick rally may occur
Bitcoin price moves higher above $19,250 against the US dollar. BTC could see a decisive upside break above the $19,500 and $19,650 resistance levels.
- Bitcoin started a new rally above the $19,200 and $19,250 levels.
- The price is trading above $19,200 and the 100 hourly simple moving average.
- There was a break above a key bearish trend line with resistance near $19,200 on the hourly chart of the BTC/USD pair (data feed from Kraken).
- The pair could start a strong rally if there is a clear move above the $19,650 resistance.
Bitcoin price gains momentum
Bitcoin price held well above the $18,800 level. BTC formed a base above the $19,000 level and started a new rally. There was a clear move above the $19,200 and $19,250 resistance levels.
There was also a break above a key bearish trend line with resistance near $19,200 on the hourly chart of the BTC/USD pair. The pair gained momentum above the $19,400 level and the 100 hourly simple moving average. It even broke the $19,500 resistance.
However, the bitcoin price failed to gain momentum above the $19,600 zone. A high was formed near $19,679 and there was a minor downside correction.
The price is now trading below the 23.6% Fib retracement level of the upward move from the $18,865 swing low to $19,679 high. On the upside, an immediate resistance is near the $19,600 level. The first major resistance is near the $19,650 level and the last high.
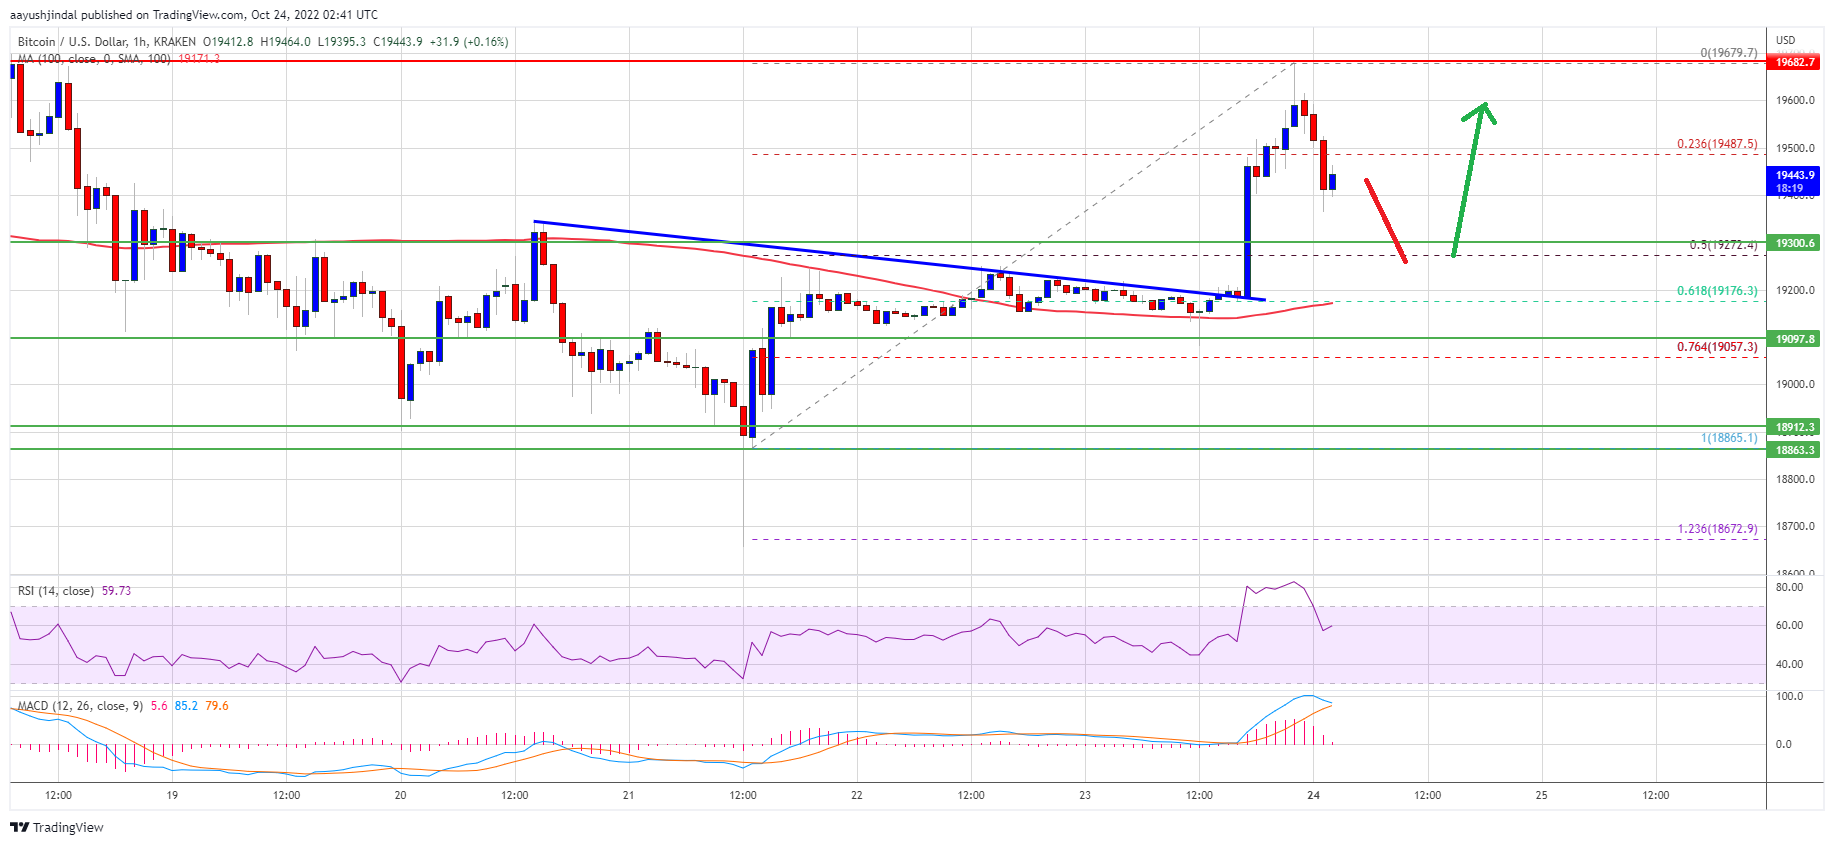
Source: BTCUSD on TradingView.com
The next major resistance could be $20,000. A clear move above the $20,000 resistance could send the price towards the $20,500 resistance. Any further gains could open the doors for a move towards the $21,200 resistance zone.
Dips supported in BTC?
If bitcoin fails to rise above the $19,600 resistance zone, it may continue to move lower. An immediate support on the downside is near the $19,300 zone.
The next major support is near the $19,250 zone. It is near the 50% Fib retracement level of the upward move from the $18,865 swing low to the $19,679 high. A downside break and close below $19,250 could increase selling pressure and the price could return to $18,800.
Technical indicators:
Hourly MACD – MACD is now losing momentum in the bullish zone.
Hourly RSI (Relative Strength Index) – RSI for BTC/USD is now above the 50 level.
Major support levels – $19,300, followed by $19,250.
Major resistance levels – $19,500, $19,600 and $20,000.


