Bitcoin price defies gravity and here’s why BTC could rise to $30K
Bitcoin price rose above the $28,000 resistance zone. BTC is correcting gains, but declines may be limited below the $26,200 support zone.
- Bitcoin is up over 20% in a few days and there was a move above the $28,000 resistance.
- The price is trading above $27,000 and the 100 hourly simple moving average.
- An important bullish trend line is forming with support near $27,100 on the hourly chart of the BTC/USD pair (data feed from Kraken).
- The pair could rise further if it holds above the $26,200 support zone.
Bitcoin Price Extends Rally
Bitcoin price held well above the $25,000 support zone. BTC started another steady rise and managed to clear the $26,500 resistance zone, outperforming altcoins like Ethereum and Ripple.
There was a clear move above the $27,500 and $28,000 resistance levels. The price traded at a new multi-week high of $28,450 and is currently correcting gains. There was a minor downside correction below the $28,200 and $28,000 levels.
Bitcoin price is now trading above $27,000 and the 100 hourly simple moving average. It is also well above the 23.6% Fib retracement level of the upward move from the $23,913 swing low to $28,450 high.
Also, there is an important bullish trend line forming with support near $27,100 on the hourly chart of the BTC/USD pair. On the upside, an immediate resistance is near the $28,000 level. The next major resistance is near the $28,500 zone or the recent high.
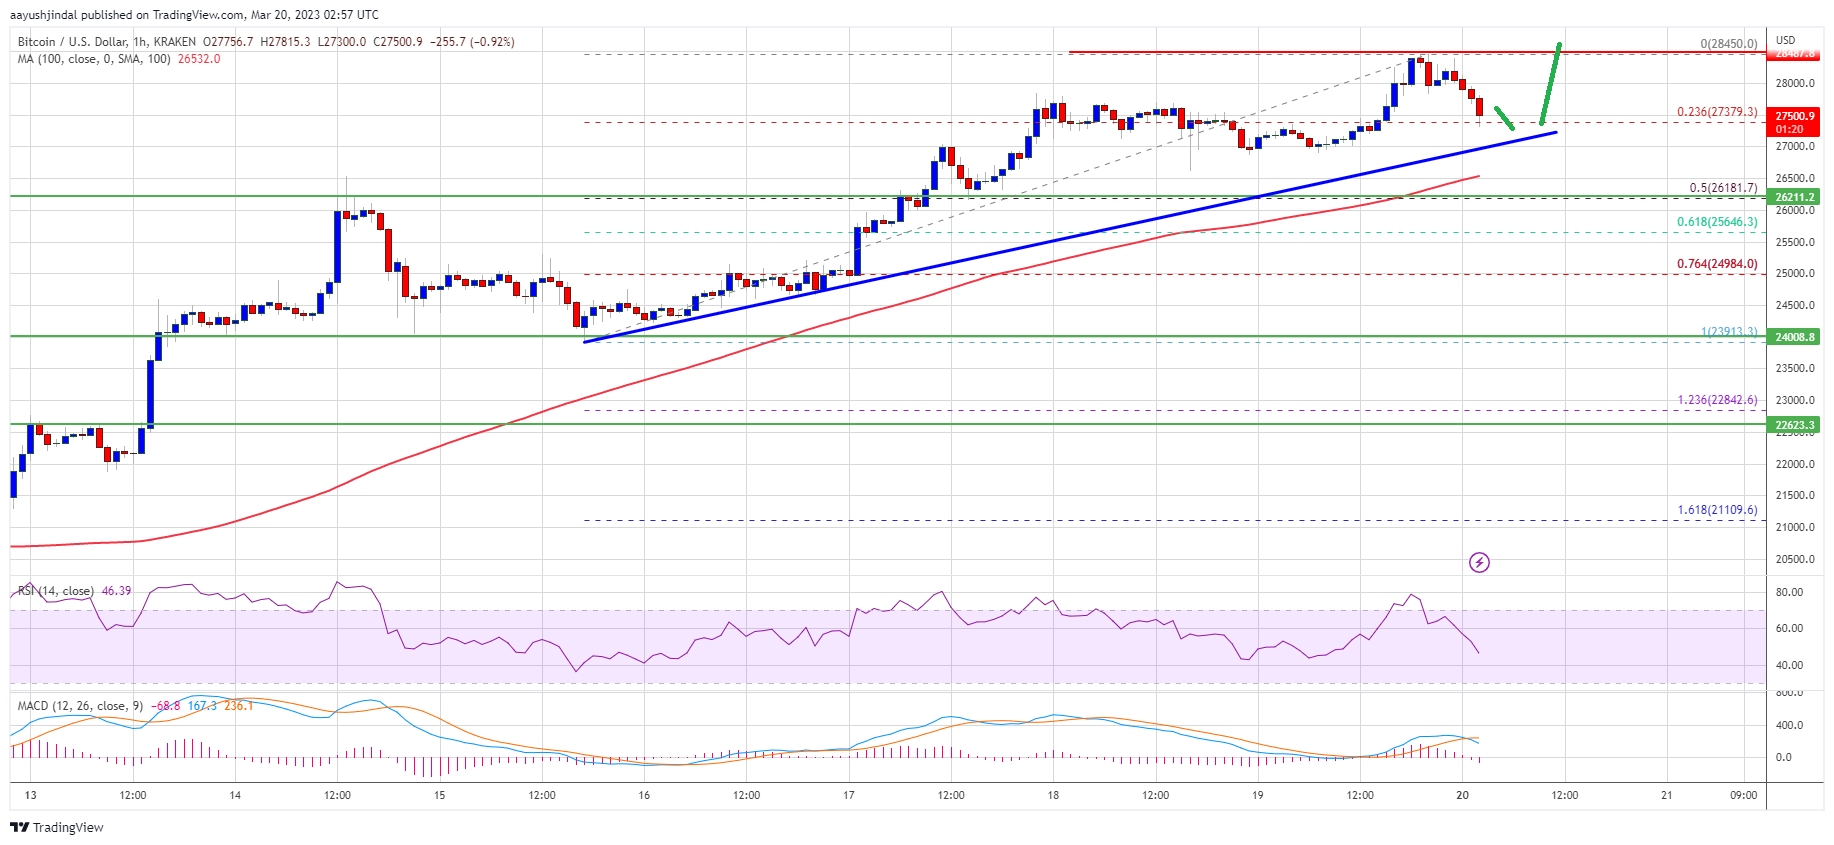

Source: BTCUSD on TradingView.com
A close above the $28,500 resistance could start another rally. In the mentioned case, the price may rise towards the $29,500 level. The next key resistance is near the $29,800 zone, above which the price could test the $30,000 barrier.
Dips supported in BTC?
If bitcoin price fails to clear the $28,500 resistance, it could initiate a downside correction. An immediate support on the downside is near the $27,400 zone.
The next major support is near the trend line and $27,000, below which the price is even testing the 100 hourly simple moving average. The next major support is near the $26,200 level. Any further losses could send the price towards the $25,000 level.
Technical indicators:
Hourly MACD – MACD is now losing momentum in the bullish zone.
Hourly RSI (Relative Strength Index) – RSI for BTC/USD is now below the 50 level.
Major support levels – $27,200, followed by $26,200.
Major resistance levels – $28,000, $28,500 and $30,000.


