Bitcoin Miners Continue Distribution, Bad Sign For Rally?
On-chain shows that Bitcoin miners have been in a distribution phase recently, a sign that could prove bearish for the price of the crypto.
Bitcoin Miner Reserve observes a downward trend as miners look to dump
As pointed out by an analyst in a CryptoQuant post, the recent selling by BTC miners could force the price down in the short term.
“Miner reserve” is an indicator that measures the total amount of Bitcoin currently stored in the wallets of all miners.
When the value of this indicator goes up, it means that miners are depositing coins into the wallet right now. Such a trend, when extended, could be a sign of accumulation from these network validators, and thus could be bullish for the price of BTC.
On the other hand, decreasing values of the metric suggest that miners are transferring a net number of coins from their reserves at the moment. Since miners usually withdraw their BTC for selling purposes, this kind of trend can be bearish for the value of the crypto.
Now, here is a chart showing the trend of the Bitcoin mining reserve over the past few months:
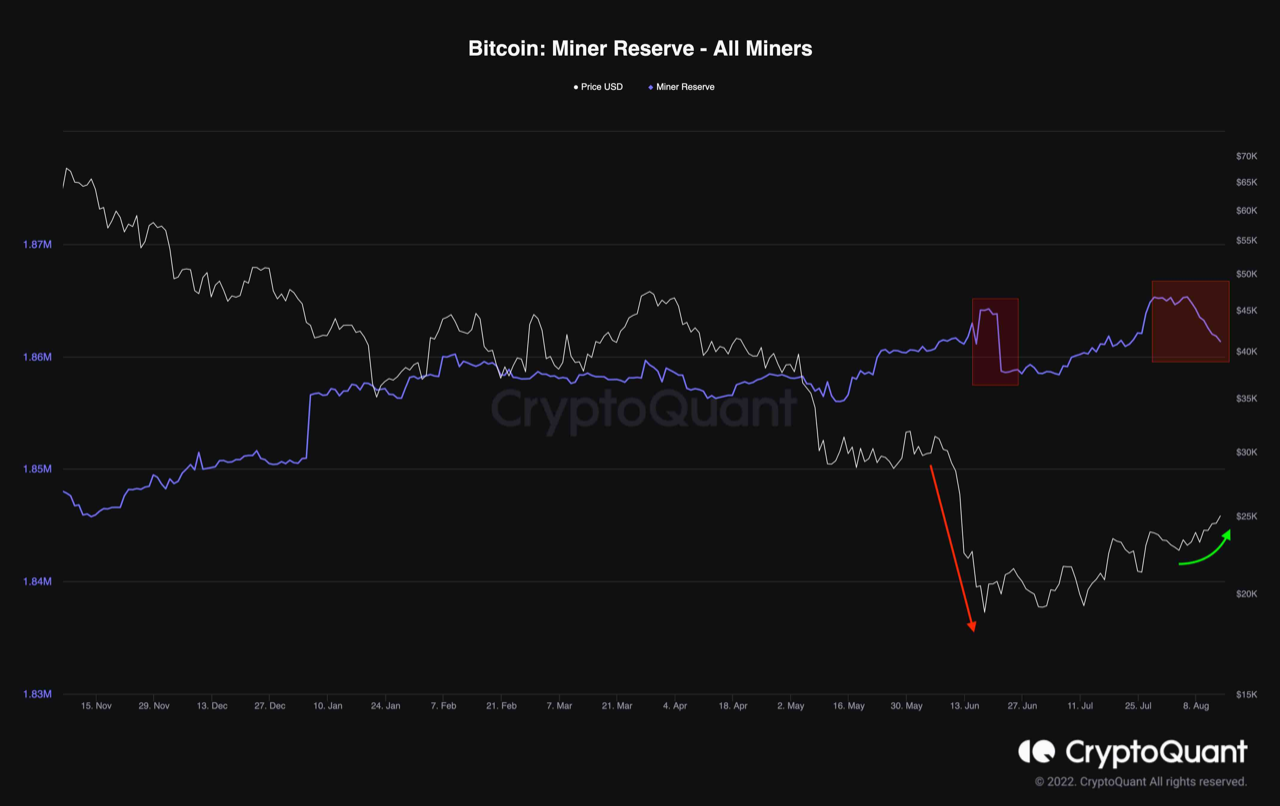
Looks like the value of the metric has been going down in recent days | Source: CryptoQuant
As you can see in the graph above, Bitcoin mining reserves have been trending down over the last couple of weeks, while the price has been going up.
This may indicate that miners may participate in distribution recently, and take advantage of the higher prices.
This selling by the miners could dampen this latest rally and reduce the value of the coin, at least in the short term.
The reason behind such dumping by this group is the recent shrinking earnings in Bitcoin mining. Many miners may have to sell more than usual to pay off operating costs with these lower earnings.
Some other miners will also have residual payments for their mining rigs, so they will have to sell more of the reserve to pay them off in the current environment.
BTC price
At the time of writing, Bitcoin’s price is hovering around $24.5k, up 6% in the last seven days. Over the past month, the crypto has increased 21% in value.
The chart below shows the trend in the price of the coin over the last five days.

The value of the crypto seems to have been moving sideways since the rise a few days ago | Source: BTCUSD on TradingView
Featured image from Dmitry Demidko on Unsplash.com, charts from TradingView.com, CryptoQuant.com


