Bitcoin market at decision point: aSOPR retests decisive level
The Bitcoin market may be close to a decision point as on-chain data shows the Adjusted Spent Output Profit Ratio (aSOPR) retesting the 1.0 level.
Bitcoin aSOPR has fallen towards a value of 1.0 recently
According to the latest weekly report from Glassnode, the BTC market had shifted towards a profit-dominated regime back in January. “aSOPR” is an indicator that tells us whether the average investor is selling Bitcoin at a profit or a loss at the moment.
The “adjusted” in aSOPR comes from the fact that this calculation has been adjusted to filter out transactions/sales of all coins that were executed within only one hour of the previous transaction/purchase. The benefit of creating this constraint is that it removes any noise from the data that would have had no discernible implications for the market.
When the value of this indicator is greater than 1.0, it means that the total profit being reaped by the investors is more than the losses right now. On the other hand, the values of the metric below the threshold suggest that the market as a whole is realizing some losses at the moment.
The 1.0 level itself naturally acts as the break-even mark, where the total profit equals the losses.
Now, here is a chart showing the trend of Bitcoin aSOPR over the last few months:
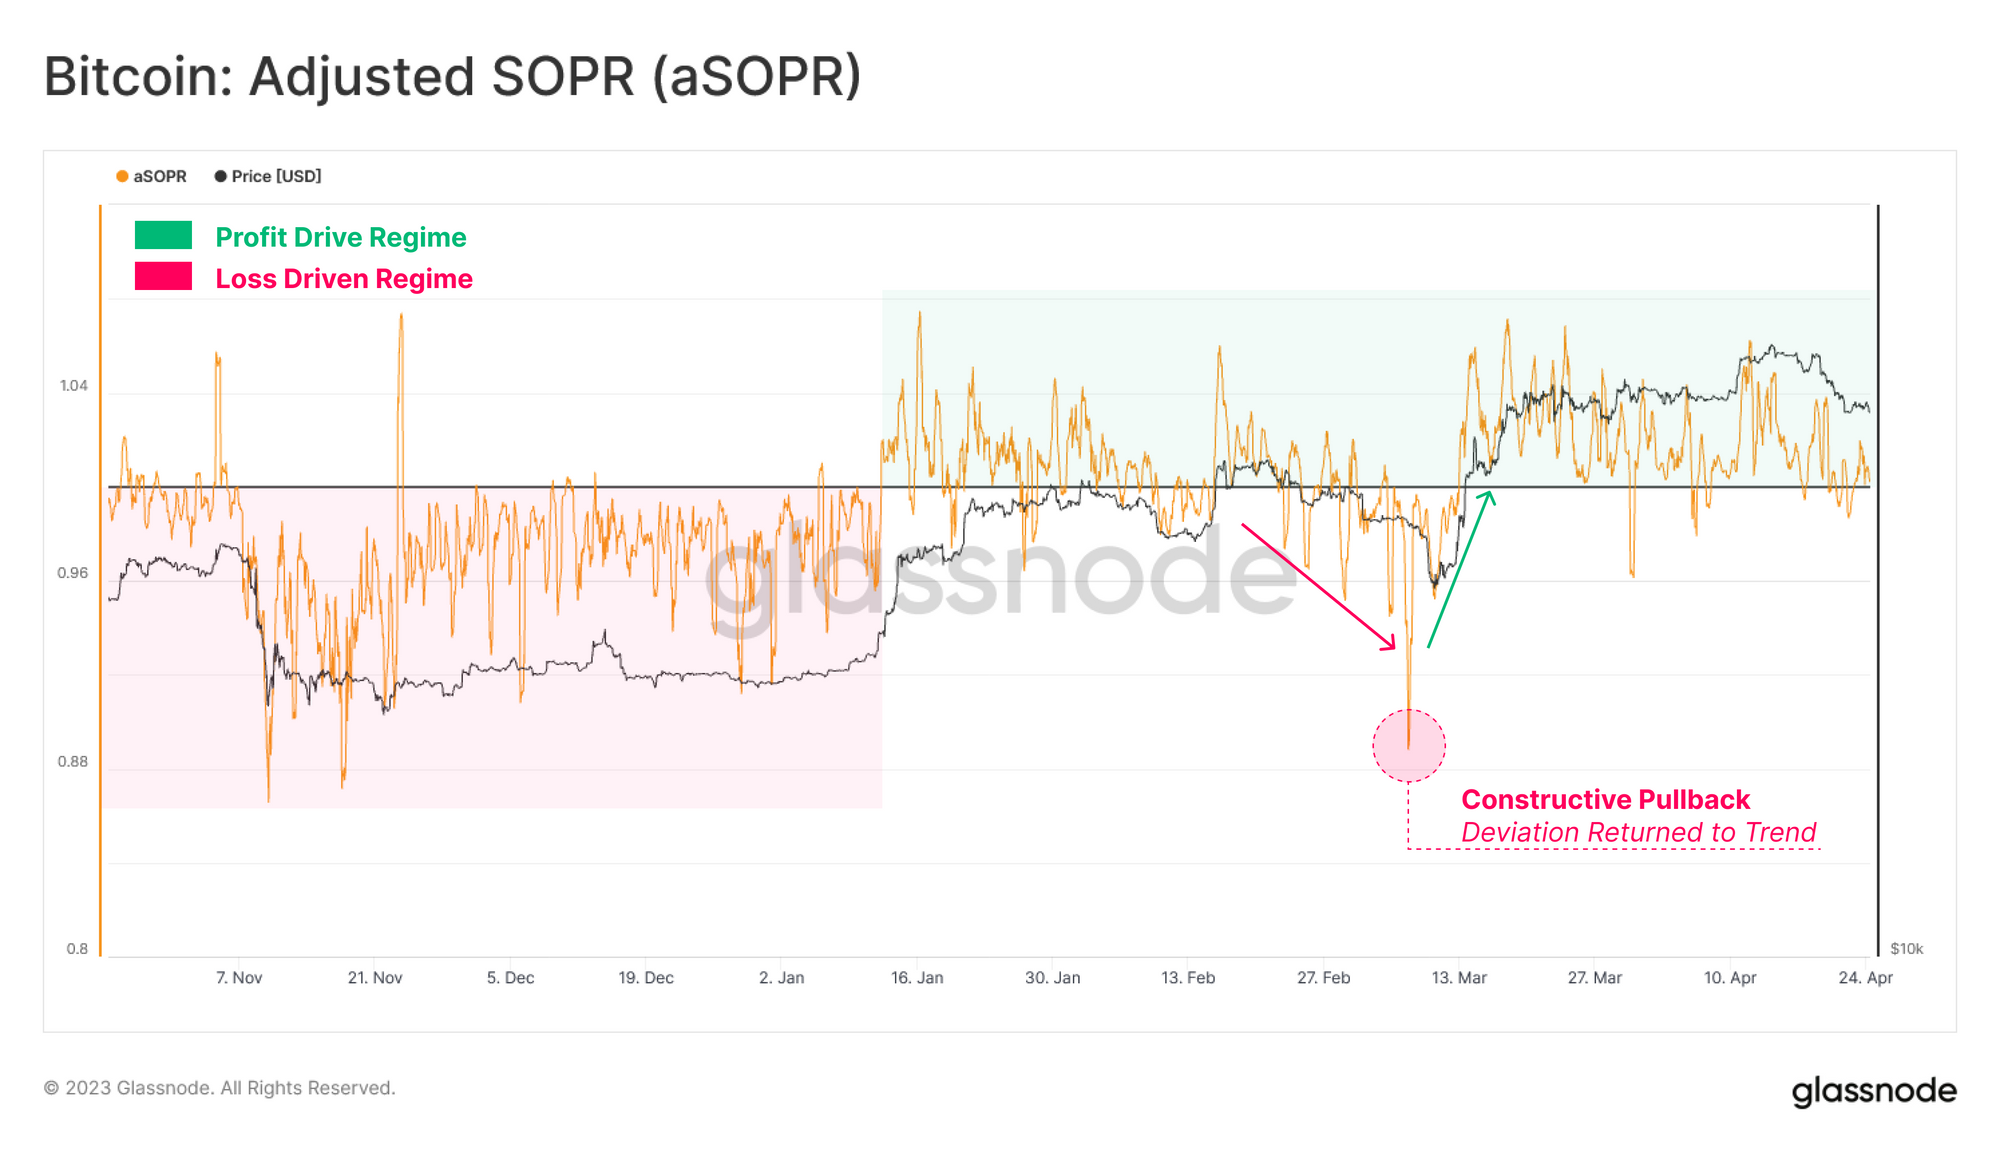

The value of the metric seems to have been above the 1.0 mark in recent days | Source: Glassnode's The Week Onchain - Week 17, 2023
Historically, the aSOPR 1.0 level has been quite important for Bitcoin, as it has represented the mark where the transition between bullish and bearish trends has taken place.
During bear markets, the indicator generally stays below this level, as investors naturally realize large losses. The mark acts as resistance in such market conditions, meaning that any attempt to break above it usually ends in failure.
On the contrary, the 1.0 level acts as a support for the price during bullish periods, ensuring that the indicator remains in the profit zone. Both of these patterns can also be seen in action in the graph above, as the 2022 bear market saw the metric stuck in the sub-1.0 zone, while the rally that started in January has seen it in the green.
However, there was an exception last month, when Bitcoin aSOPR plunged sharply below the 1.0 mark due to a sharp drop in price. However, it didn’t take long for the metric (and also the price) to reverse back towards the bullish trend, suggesting that it was only a temporary anomaly.
Recently, as the asset’s price has again declined, the indicator has also fallen towards the 1.0 level. “With aSOPR currently retesting the break-even level of 1.0, this puts the market close to a decision point,” explains Glassnode.
It now remains to be seen if the retest will succeed and this level will act as support for the price, or if a break below will take place, possibly bringing more declines for the cryptocurrency.
BTC price
At the time of writing, Bitcoin is trading around $27,300, down 10% in the last week.

BTC has seen some sharp decline recently | Source: BTCUSD on TradingView
Featured image from Maxim Hopman at Unsplash.com, Charts from TradingView.com, Glassnode.com


