Bitcoin halving pattern suggests that price will cross above higher, realized value
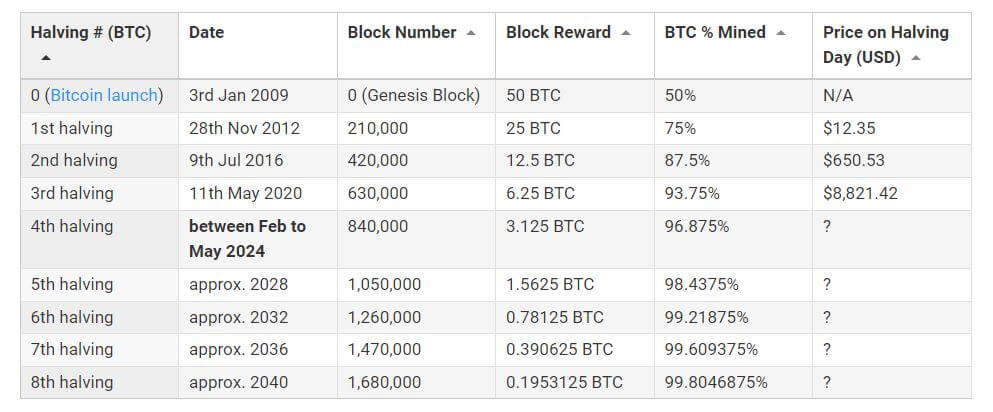
The Bitcoin halving refers to an event where miners’ block rewards are halved. This happens approximately every four years, depending on when a total of 210,000 blocks have been mined since the previous halving date.
As a result, the number of new tokens entering circulation decreases and fewer tokens enter the supply – making Bitcoin more scarce over time.
This process will continue until the last halving 2136 when the mining reward will be cut to 0.00000001 BTC.
Where are we in the current Bitcoin halving cycle?
The third and next halving is on track to complete on March 25, 2024, with approximately 75,000 blocks remaining before reaching that point.
Based on this moving estimate, the number of days from the previous halving, May 11, 2020, comes to 1,414 days. Previous halvings took:
- 1st halving: November 28, 2012 to July 8, 2016 – 1,318 days.
- 2nd halving: 9 July 2016 to 10 May 2020 – 1401 days
The halving day price has so far recorded gains over the price of the previous halving day, lending support to the theory that BTC scarcity is driving the price up.
But is that the whole story?
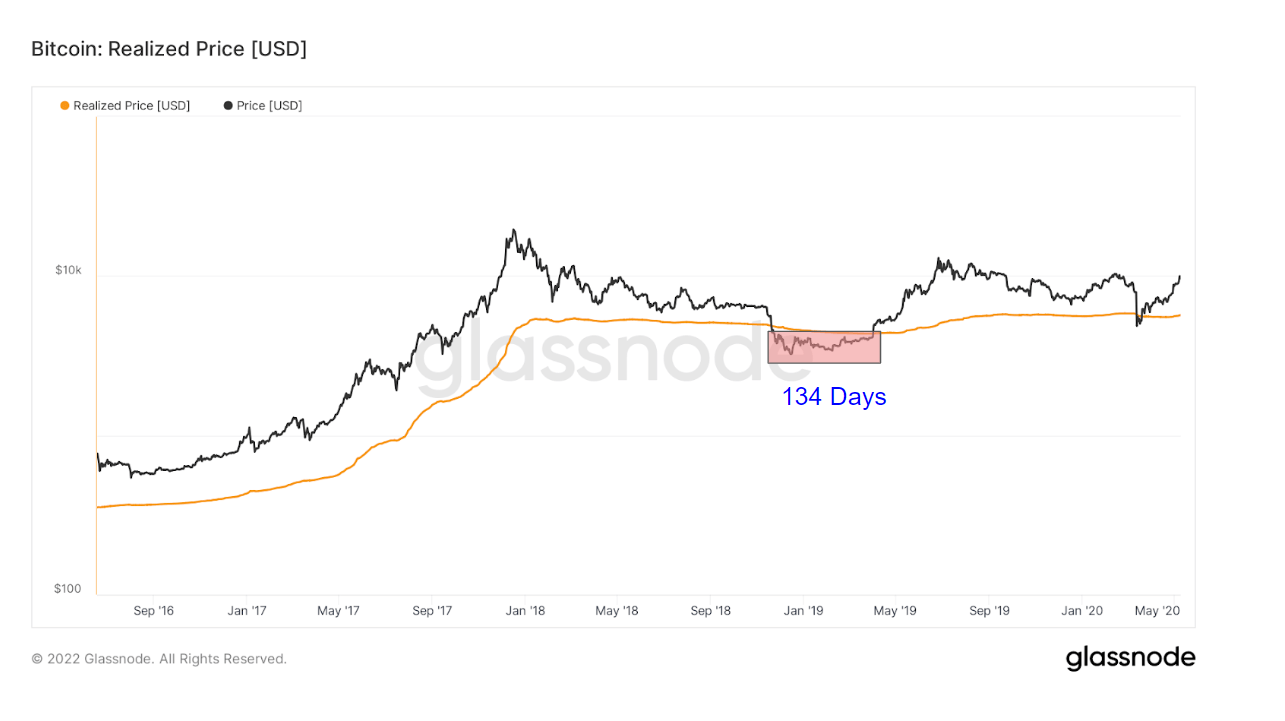
Realized price
Realized price is calculated by taking the realized total market value and dividing it by the number of Bitcoins in circulation. In other words, realized price is an alternative to the actual market price and measures what the market as a whole paid for its BTC on average.
Traders consider Realized Price as support and resistance price levels in the chain. An actual price above the realized price indicates that the market as a whole is in profit and is considered a sell indicator (bearish).
In contrast, an actual price below the realized price indicates that the market as a whole is in loss and is thought of as a buy (or bottom) indicator (bullish).
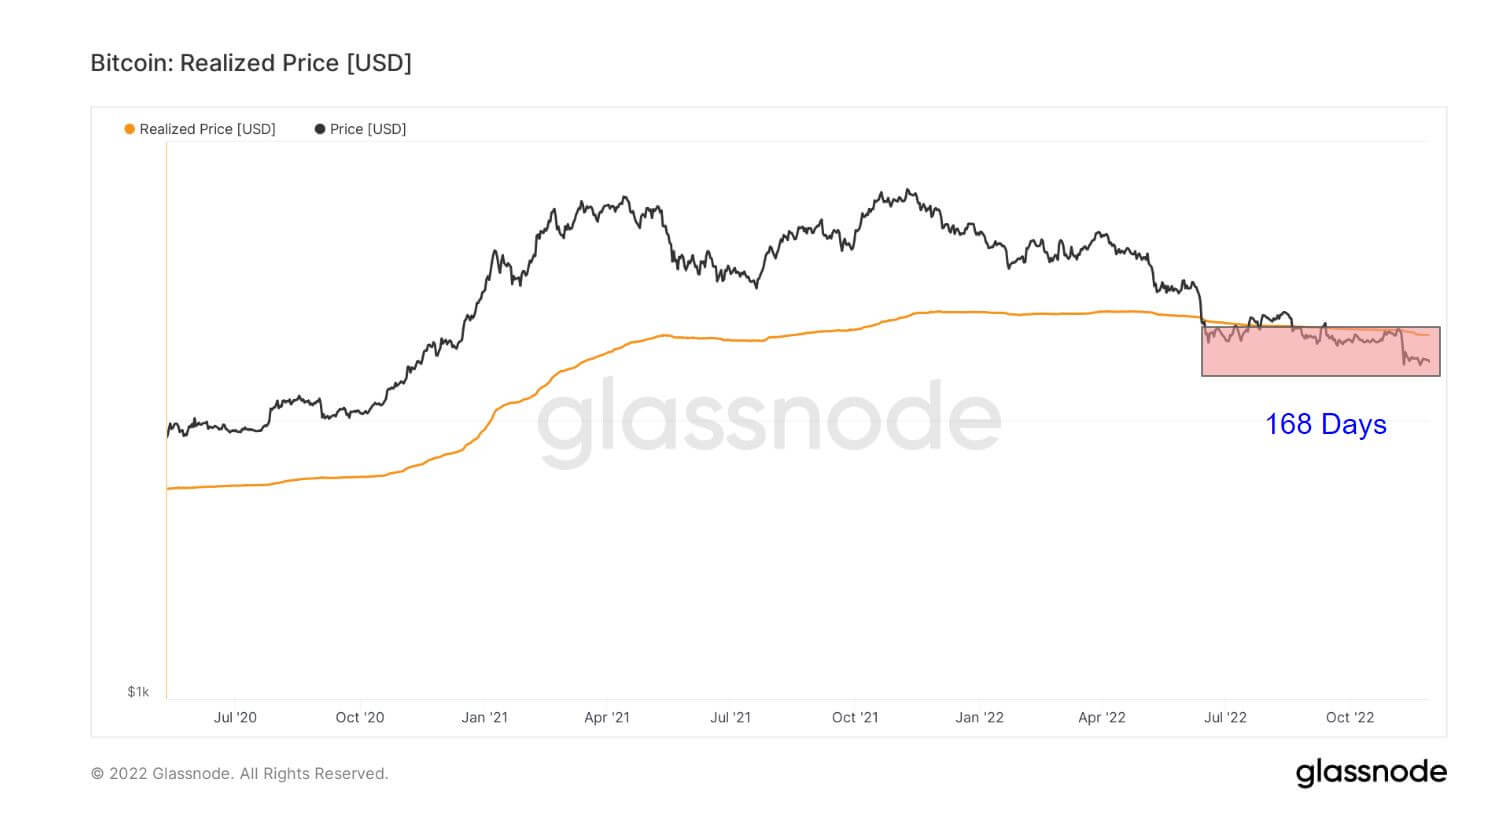
On-chain analysis of Glassnode data revealed continuous, extensive periods of realized price below the actual price in the run-up to each respective halving start date.
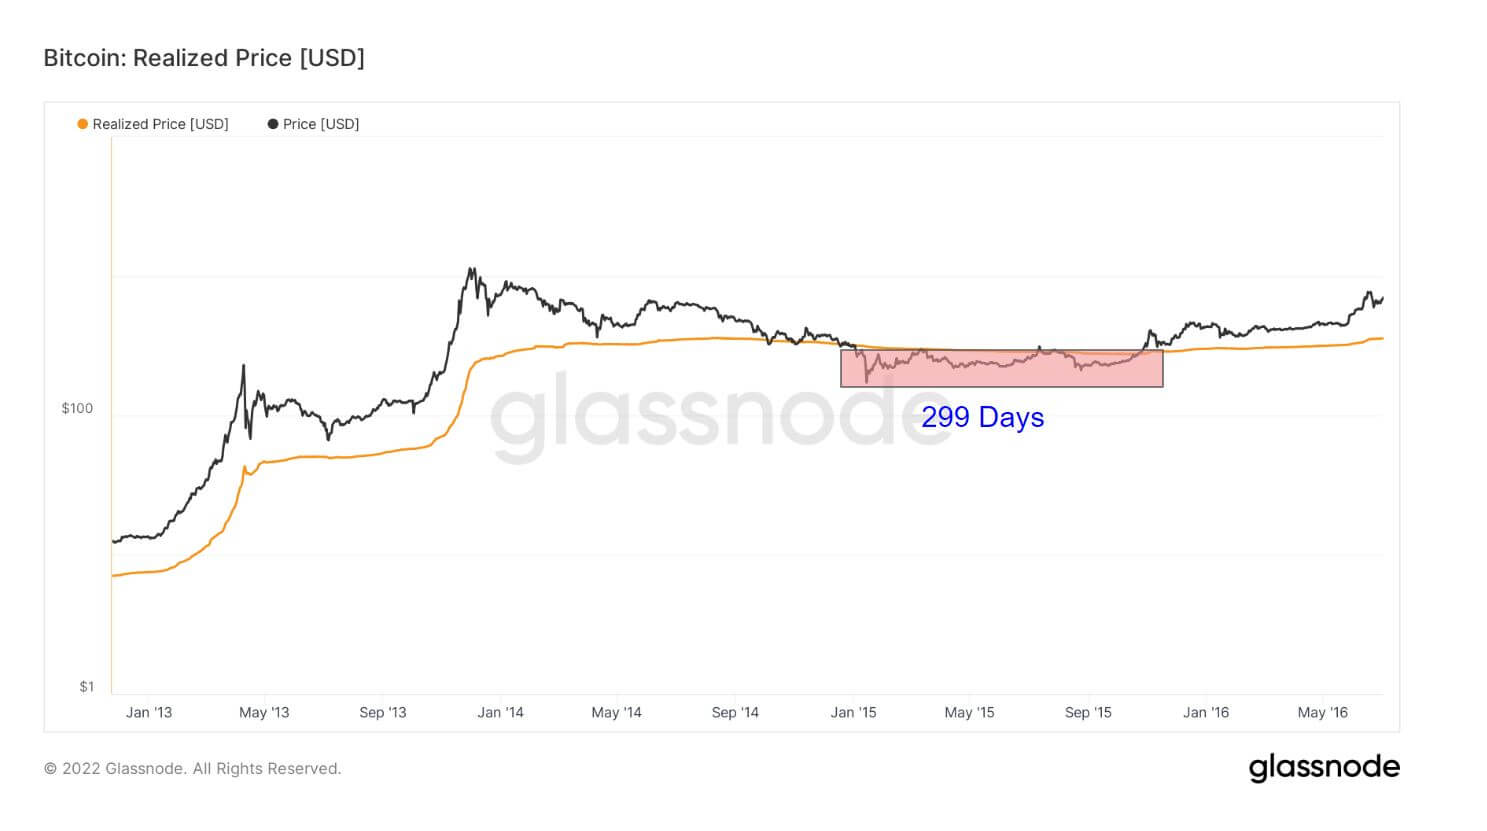
The first halving saw BTC below its realized price for 299 days before the next halving occurred around seven months later in July 2016.
The second halving saw BTC below the realized price for 134 days (and again briefly in April 2020) before the next halving occurred approximately twelve months later in May 2020.
Counting down to the third halving, the realized price is currently below BTC and has been since 168 days ago. The actual price of BTC is currently below the realized price of $21,000, which suggests an increase in the actual price of cards, which happened in previous cases.