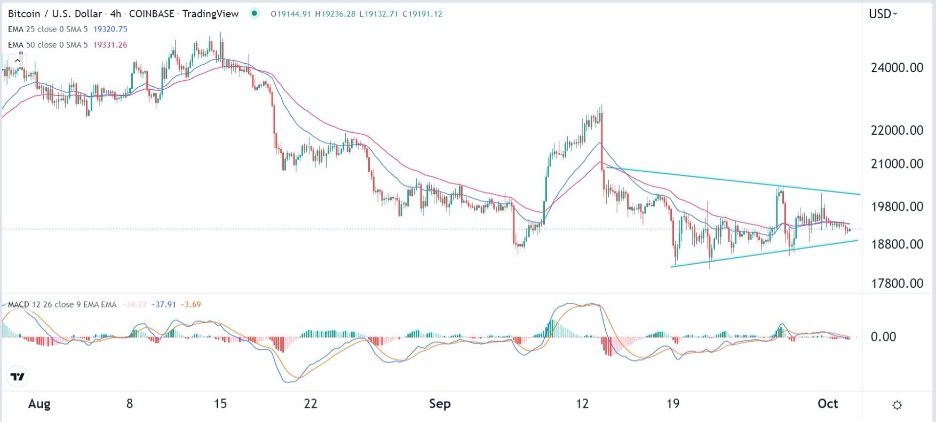
Bitcoin forms a symmetrical triangle

In particular, Bitcoin managed to outperform US stocks.
Bearish view
- Sell the BTC/USD pair and set a take profit of 18,000.
- Add a stop loss of 20,500.
- Timeline: 1-2 days.
Bullish view
- Set a buy stop at 19,800 and a take profit at 21,000.
- Add a stop loss of 18,000.
The BTC/USD price continued to consolidate as investors waited for the next catalyst. Bitcoin was trading at $19,200, where it has been for the past few weeks. It fell by approx. 3% in September as the US dollar index (DXY) rose to its highest level in more than two decades.
Bitcoin outperforms assets
The BTC/USD price has continued to move sideways in recent weeks, even as fears of more interest rate hikes persisted. Economists and the bond market are pointing towards a more aggressive Fed. The yield on the 10-year government bond rose to 4% for several decades.
Correspondingly, the two-year interest rate is comfortably above 4.2%. These figures therefore point to an interest rate increase of at least 125 basis points this year. As such, this would be the most aggressive the Fed has been in decades.
In particular, Bitcoin managed to outperform US stocks. The S&P 500 index crashed by more than 11.8% in September. Correspondingly, the technology-heavy Nasdaq 100 index fell by 12.5%. This means that the correlation that existed between US stocks and Bitcoin has faded.
Another notable thing is that Bitcoin moved sideways as the US dollar strength continued. The US dollar index, which measures the performance of the USD against a basket of currencies, rose to a two-decade high. Historically, Bitcoin has an inverse relationship with the US dollar. Bitcoin also faltered as commodities such as gold and crude oil fell.
Interestingly, this consolidation continued as signs of fear in the market. For example, the closely watched Fear and Greed Index crashed into the extreme fear zone in September. As such, since Bitcoin has struggled to test its year-to-date lows, it could be a sign that some investors have started to rally.
BTC/USD Forecast
The four-hour chart shows that the pair has been in a tight range for the past few weeks. Along the way, it has formed a symmetrical triangular pattern, which approaches the confluence pattern. The pair is consolidating along the 25-day and 50-day moving averages. Oscillators such as the MACD and the Relative Strength Index (RSI) have all pointed downward.
Therefore, the BTC/USD price is likely to remain in this tight range as the triangle pattern continues to form. The key support and resistance levels to watch will be at 18,000 and 21,000.
 Ready to trade our free signals? Here are the best MT4 crypto brokers to choose from.


