Bitcoin, Ethereum, Avalanche Price Analysis

Bitcoin Analysis
Bitcoin’s price has market participants questioning whether they are preparing to set a second low or whether we are witnessing a typical bearish backtest before further capitulation to the downside. Despite the bearish divergence that continued to build on Monday, BTC’s price ended in the green and was +$121 for its daily session.
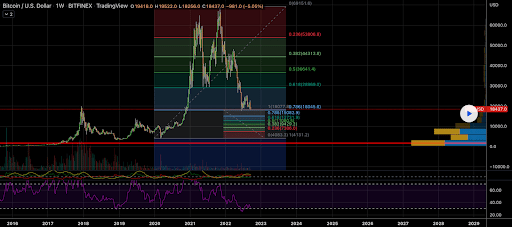
The BTC/USD 1W Chart below from GiraffePiWorld is the first chart we examine today. BTC’s price trades between the 1 fibonacci level [$18,077.8] and 0.618 [$28,969.0]at the time of writing.
Bullish traders hope they can regain territory above BTC’s previous ATH of $19,891 from 2017 or they risk facing further downside in the near term. The overhead targets on BTC are 0.618, 0.5 [$36,641.4]0.382 [$44,313.8]0.236 [$53,806.8]and 0 [$69,151.6].
Bearish traders looking to push BTC’s price below the recent low made earlier this year at $17,611 if they succeed in breaking the 1 fibonacci level.

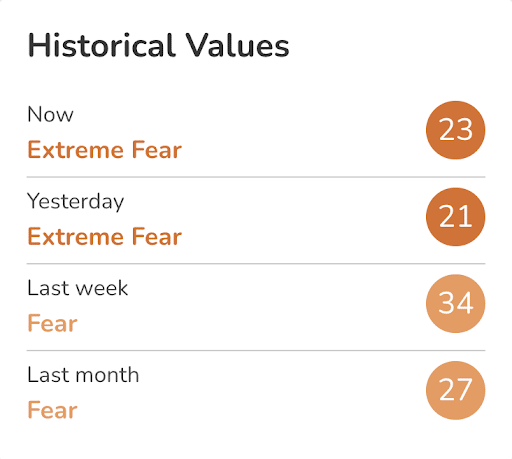
The fear and greed index is 23 Extreme fear and is +2 from Monday’s reading of 21 Extreme Fear.

Bitcoin’s Moving Average: 5-day [$19,720.64]20 days [$20,283.67] 50 days [$21,716.63]100 days [$24,200.62]200 days [$33,267.1]Year to date [$32,121.57].
BTC’s 24-hour price range is $18,232.6-$19,686.2 and its 7-day price range is $18,232.6-$22,534.61. Bitcoin’s 52-week price range is $17,611-$69,044.
The price of Bitcoin on this date in 2021 was $43,002.
The average price of BTC for the last 30 days is $20,470.3 and its -18.2% in the same period.
Bitcoin’s price [+0.62%] closed its daily candle at $19,538.7 on Monday and returned to the green for the third time in the past four days.
Ethereum analysis
Ether price has fallen more than 1% per day over the past 30 days, and bullish traders are looking for a reprieve from bearish selling pressure. That pressure eased a bit on Monday and ETH’s price ended its daily session +$40.89.
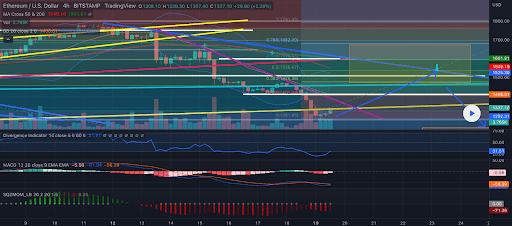
The ETH/USD 4HR Chart below of peterbhc is the second chart we provide analysis for today. Ether’s price trades between the 0 fib level [$1,281.88] and 0.236 [$1,402.04]at the time of writing.
If bullish Ether traders want to try to stop the bleeding to the downside of the 4-hour timeframe, they need to regain 0.236 with a secondary target of 0.382 [$1,476.38]. The third target for bullish traders is 0.5 [$1,536.47]followed by goals of .618 [$1,696.55]0.786 [$1,682.09]and 1 [$1.791.05].
Conversely, bearish traders aim to push ETH’s price below the $1,300 level with a secondary objective of a full retracement of 0 [$1,281.88].

Ether’s moving average: 5 days [$1,494.19]20 days [$1,590.41]50 days [$1,603.67]100 days [$1,638.15]200 days [$2,372.82]Year to date [$2,255.65].
ETH’s 24-hour price range is $1,280-$1,393.35 and its 7-day price range is $1,280-$1,736.28. Ether’s 52-week price range is $883.62-$4,878.
Ether’s price on this date in 2021 was $2,975.9.
The average price of ETH for the last 30 days is $1,585.77 and its -26.7% over the same duration.
Ether price [+3.06%] closed its daily candle on Sunday worth $1,376 and with green figures for the second time in three days.
Landslide analysis
Avalanche’s price also experienced a setback on Monday, and as traders settled to end Monday’s daily session, AVAX was +$0.57.
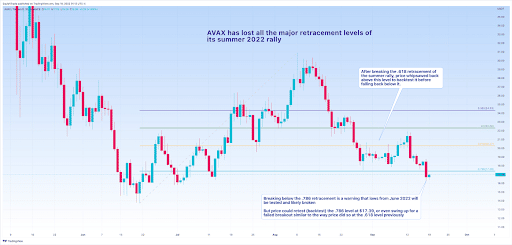
The third and final chart for analysis this Tuesday is AVAX/USD 1D Chart below from SquishTrade. Avalanche’s rate trades between 0.786 [$17.39] and 0.618 [$20.27]at the time of writing.
Bullish Avalanche market participants has target upside of 0.618 [$20.27]0.5 [$22.3] and 0.382 [$24.33].
As noted by the chart list below, if AVAX’s price tests its 2022 low at the 0.786 fibonacci level, we could soon see a new low for the year.

Avalanche moving average: 5-day [$18.33]20 days [$19.81]50 days [$22.35]100 days [$24.47]Year to date [$36.8].
Avalanche’s 24-hour price range is $16.39-$17.38 and its 7-day price range is $16.39-$21.67. AVAX’s 52-week price range is $13.75-$146.29.
The Avalanche’s price on this date last year was $57.25.
The average price of AVAX in the last 30 days is $20.07 and its -33.11% over the same period.
Avalanche’s price [+3.41%] ended its daily session on Sunday worth $17.28.


