Bitcoin buying pressure is increasing as the supply of stablecoins increases
Stablecoins are cryptocurrencies that tie their value to reference assets, including fiat currencies, commodities or other cryptocurrencies.
They form an integral part of the crypto ecosystem by offering price stability in an otherwise volatile market. By cycling in and out of stablecoins, users provide liquidity and exit positions.
This cyclical relationship between Bitcoin and stablecoins can provide insight into market sentiment and indicate periods of buying and selling pressure.
Data from Glassnode and analyzed by CryptoSlate shows a perfect storm of potential buying pressure building. However, macro uncertainty continues to weigh heavily.
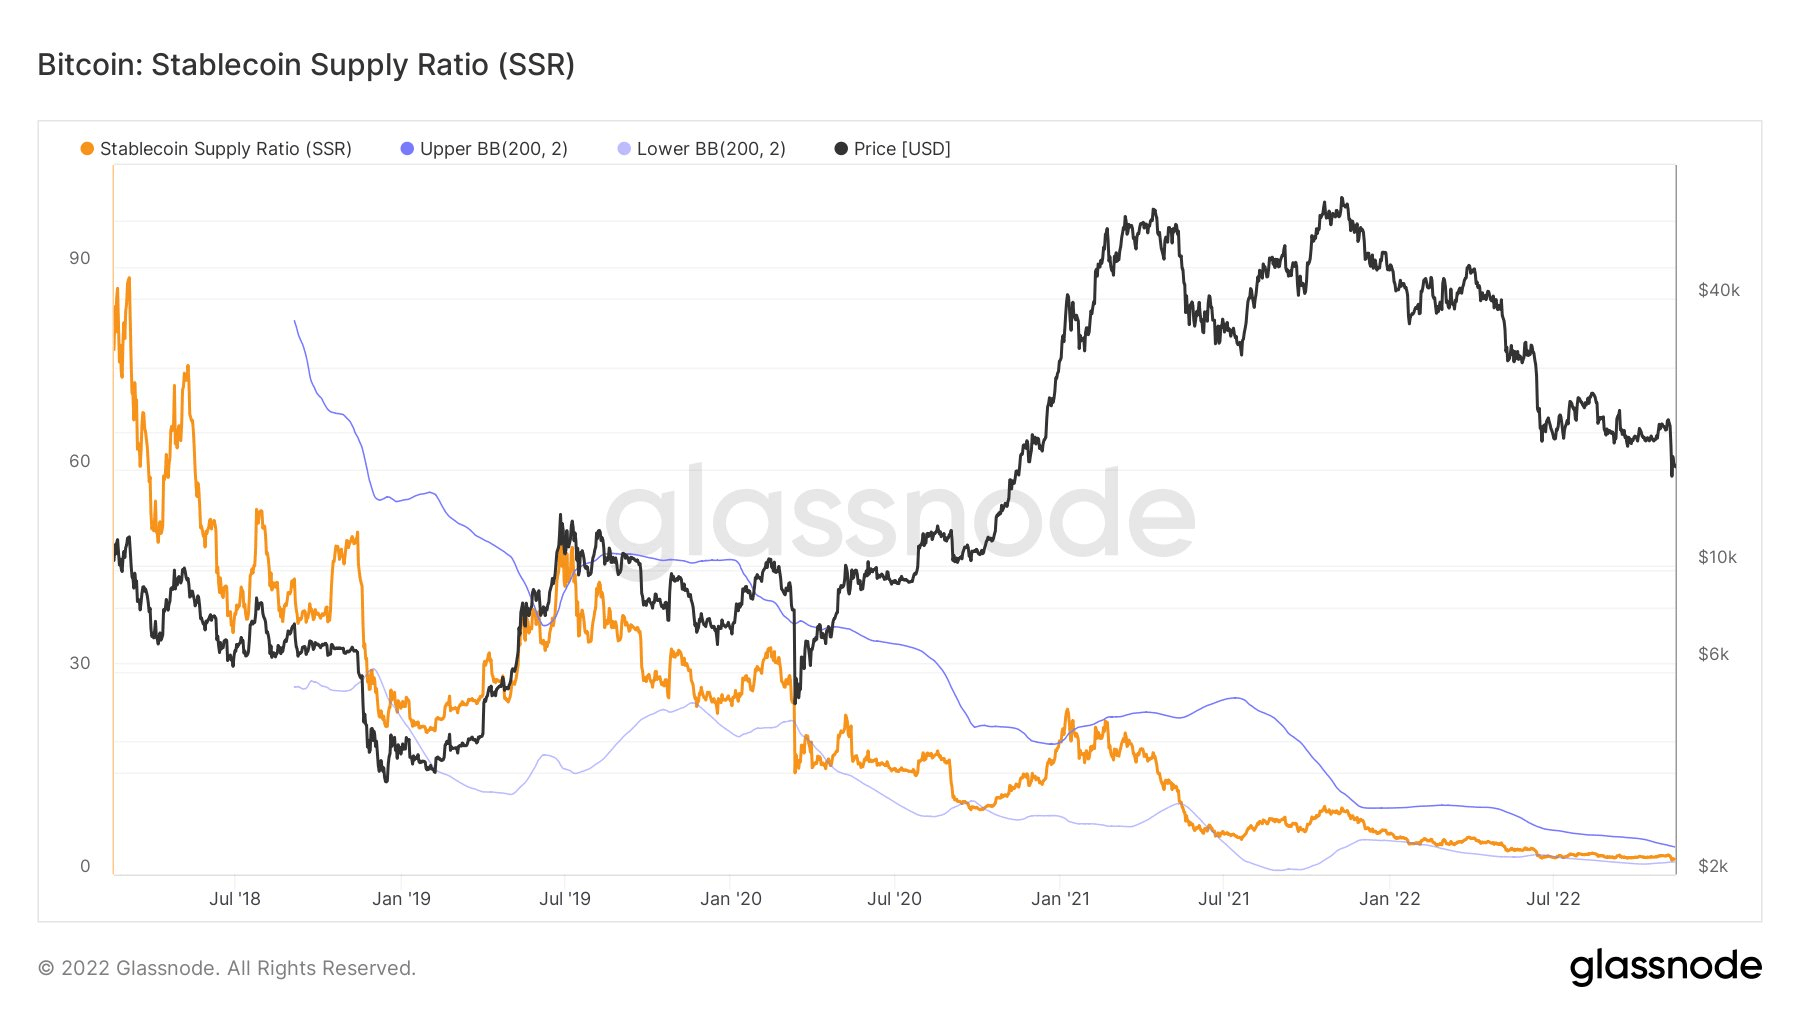
Bitcoin: Stablecoin Supply Ratio
The Stablecoin Supply Ratio (SSR) is calculated by dividing Bitcoin’s market value by the market value of all stablecoins. Comparing the market values of Bitcoin and stablecoins, SSR can be considered a measure of strength between the two.
A high SSR indicates low potential buying pressure and is considered bearish. Conversely, a low SSR means high potential buying pressure which makes this situation bullish.
The chart below shows the SSR on a macro downtrend since the start of 2018, moving significantly lower from July 2021 onwards and declining further into 2022.
A current reading of 2.28 shows that for every $1 in stablecoins there is $2.28 of Bitcoin – a situation of high potential buying pressure for Bitcoin.
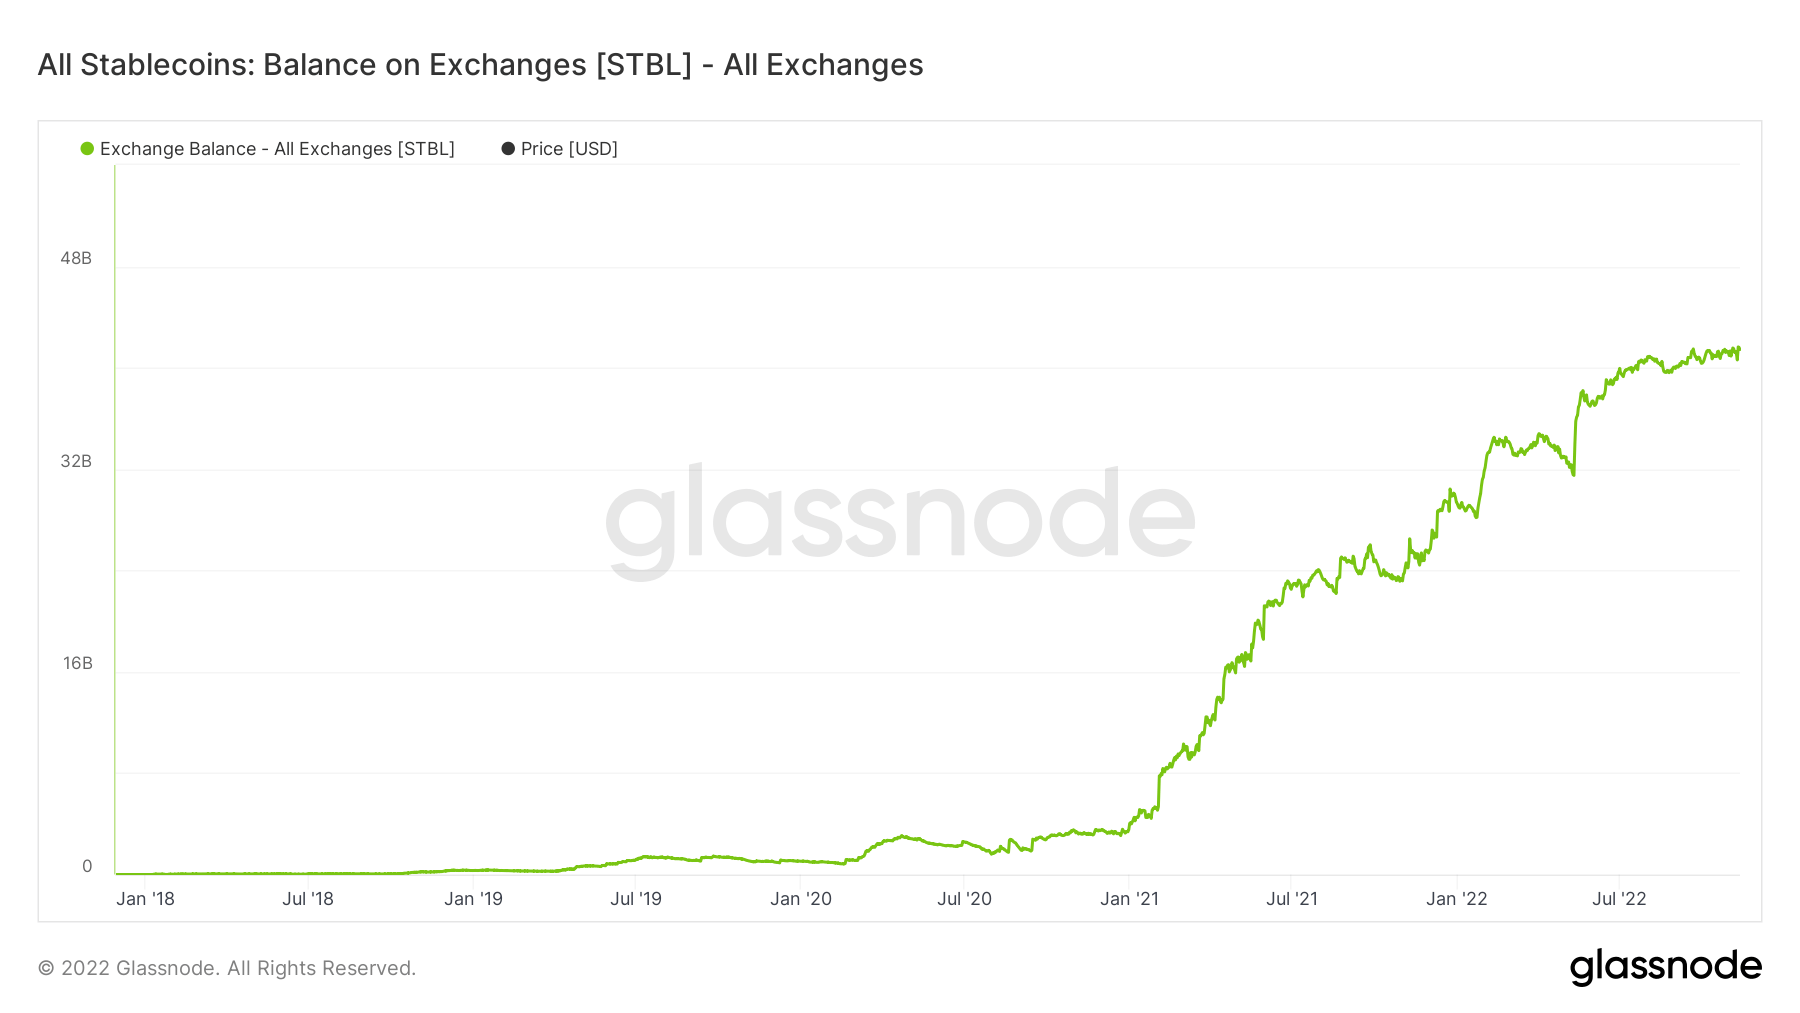
Stablecoin: Balance on exchanges
Stablecoins: Balance on Exchanges (SBoE) looks at the total number of stablecoins held on exchanges. Rising SBoE is considered bullish, indicating a continuous build-up of collateral liquidity ready to pounce.
The SBoE started trending higher from January of this year to a peak of about $46 billion currently.
Given macro uncertainty, liquidity is likely to sit on the sidelines waiting for a bottom in older markets before cycling into Bitcoin and other cryptocurrencies.
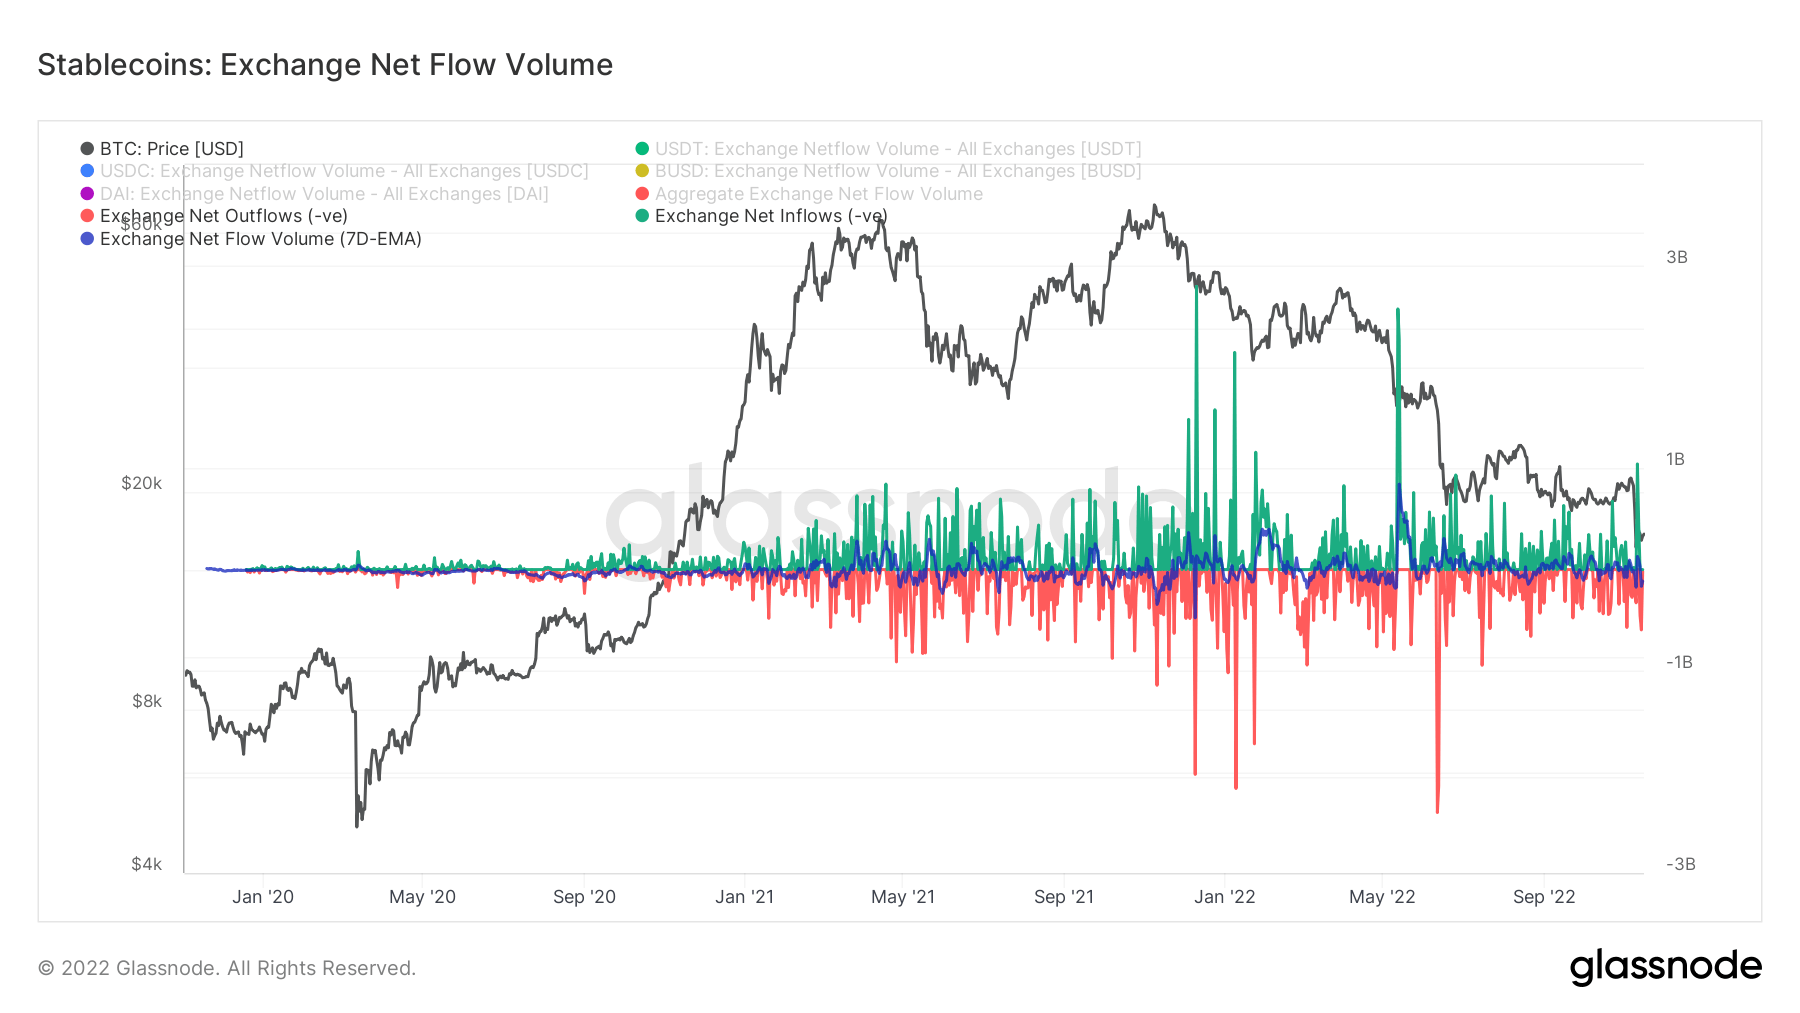
Stablecoin: Exchange Net Flow Volume
Stablecoin: Exchange Net Flow Volume shows the daily net movement of stablecoins in and out of exchanges for the top four stablecoins. These are USDT, USDC, BUSD and DAI, but the data only includes movements via the Ethereum blockchain.
Positive net flow (green) refers to the inflow of stablecoins into exchanges, increasing supply. Negative net flow (red) is when exchanges experience overall outflows.
The chart below shows current inflows in excess of $1 billion, marking the seventh highest inflows to date – providing further confirmation that traders are ready to pounce when favorable market conditions are present.