Bitcoin Bullish according to Stock-to-Flow (S2F) model
The Stock-to-Flow (S2F) model, popularized by analyst PlanB, has received as much a wave of initial admiration as subsequent criticism.
Recently, the creator of this famous model published its latest long-term chart called Bitcoin Market Stages.
The main conclusion of Bitcoin Market Stages is that the largest cryptocurrency has entered a new bull market from the beginning of 2023. As PlanB explains in a YouTube video, the new model is based on only one on-chain variable. However, he does not reveal which metric he is referring to.
The analyst then adds that Bitcoin Market Stages is not a predictive or valuation model (like Stock-to-Flow, for example). Its sole purpose is to try to estimate (detect) which stage of the market cycle Bitcoin is in. PlanB highlights the benefits of its new model in a simple way:
“It is my favorite chart after Stock-to-Flow because it is very simple, intuitive and useful.”
Bitcoin Market Stages: The market moves in cycles
The basic premise of Bitcoin Market Stages is that every market (including cryptocurrencies and Bitcoin) moves in cycles. Moreover, these cycles are based on mathematical and fractal similarities, which are nothing more than a quantitative representation of human psychology.
The analyst believes that “the feelings associated with the phase of the cycle can tell you something completely different; therefore, it is important to know what stage of the cycle you are in.” Hence the idea for the Bitcoin Market Stages chart – to make his followers aware that the market often shows something fundamentally different from our emotions.
PlanB’s new model is very simple and assumes that the market cycle contains 4 successive phases or stages:
- Early Bull Market (Blue)
- Late Bull Market (Green)
- Early Bear Market (Yellow)
- Late bear market (red)
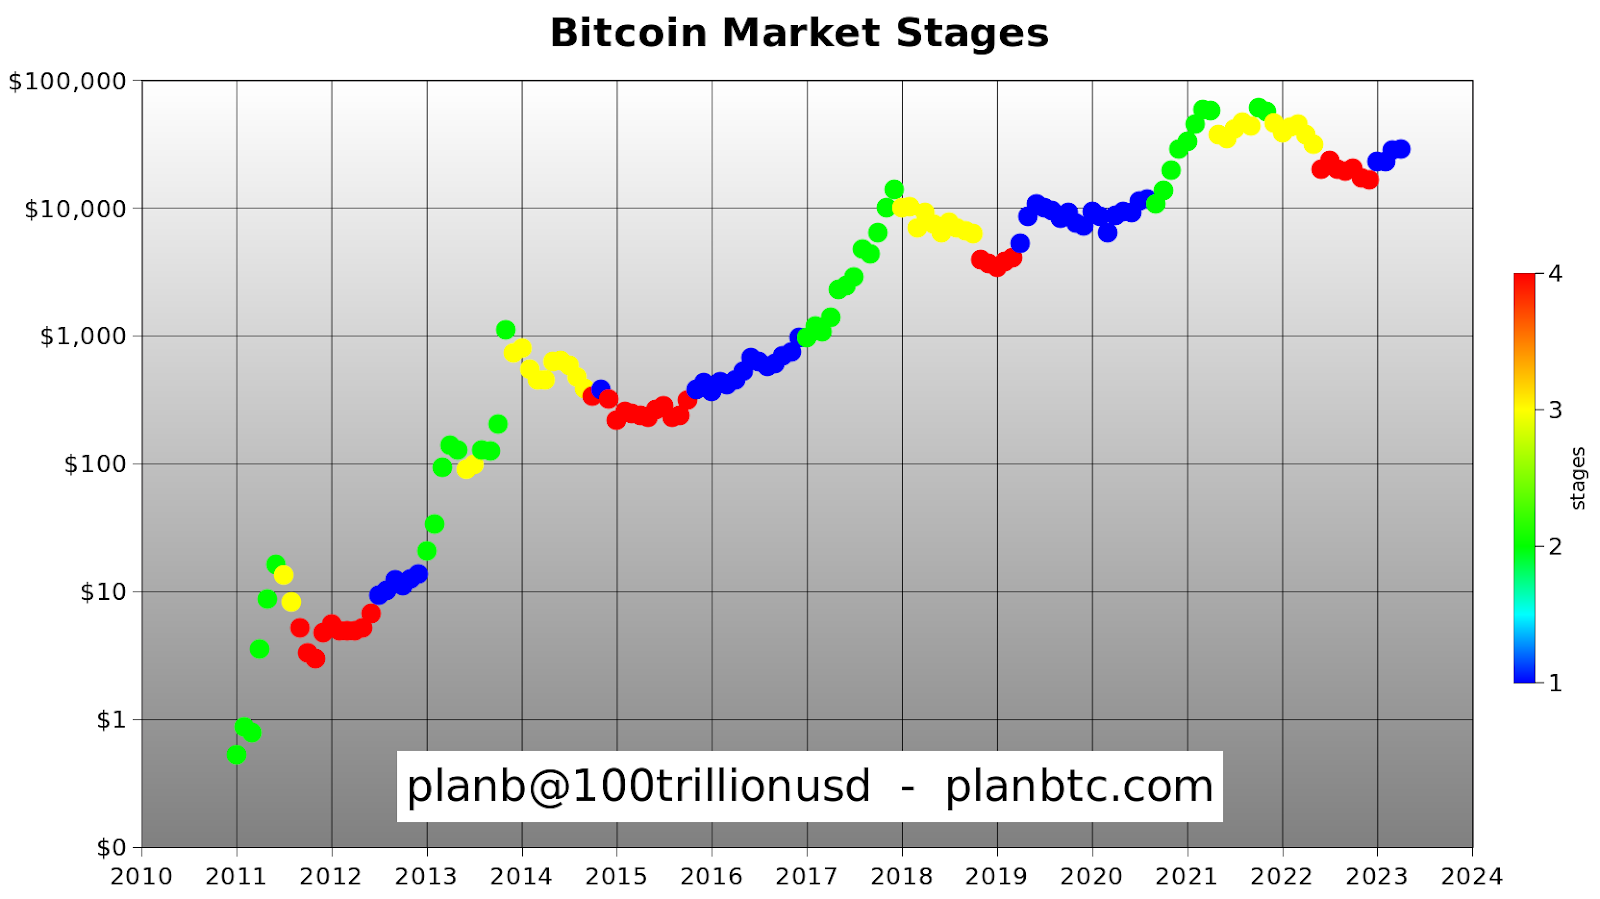
Looking at the chart above, we see that the late bear market phase ended at the end of 2022. Also, it completed the fourth cycle in a row, counting from 2011. PlanB concludes:
“We are not starting a new cycle, so we are now in an early bull market IMO.”
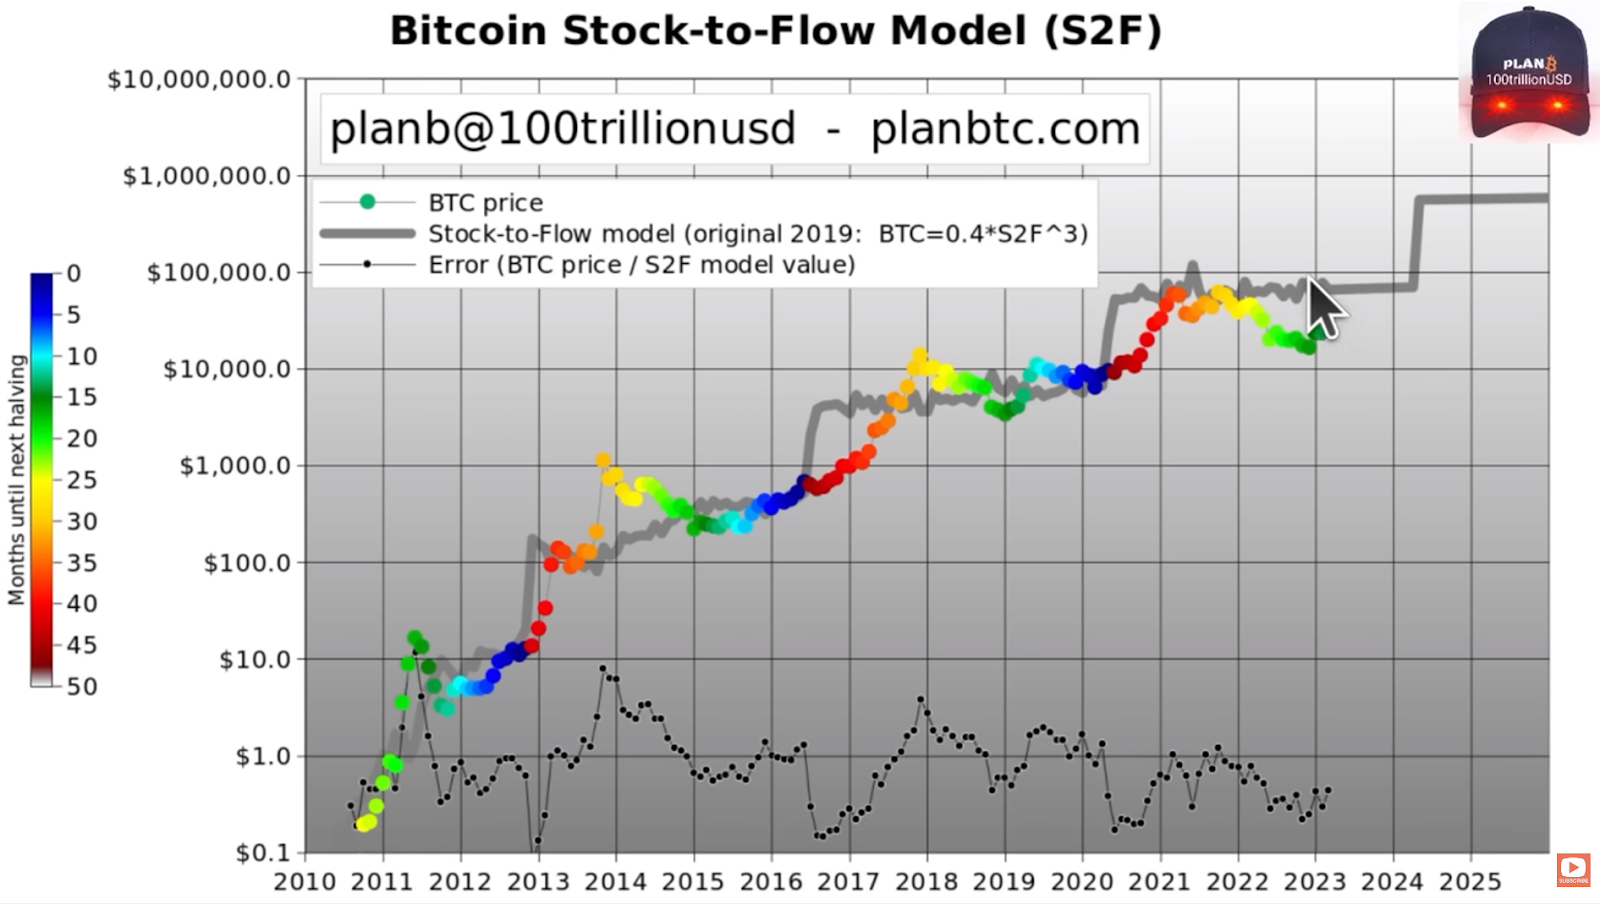
Stock-to-Flow (S2F) update
In addition to presenting its new chart, PlanB also discusses an update to its famous S2F. It is based on historical halvings, of which there have been 3 so far, while a further 4th halving is expected already next year.
PlanB explains that “halving introduces an increased scarcity of Bitcoin. Therefore, the market value of BTC is expected to increase between halvings.”
It is interesting to note that the famous analyst has created at least 3 versions of S2F over the years. The original model was published in 2019 and is based on monthly valuations of BTC and its scarcity generated by successive halvings. In this model, the current price of BTC is estimated at $55,000.
The other two models are the annual S2F and the so-called Stock-to-Flow Cross Asset Model (S2FX). According to the first, the average price of BTC in the current cycle should be $100,000. According to the second, as much as $288,000. Although the latter value is significantly different from Bitcoin’s current price, PlanB says:
“I still believe that the Stock-to-Flow Cross Asset Model, based on gold and silver, is fundamentally the most valuable model.”
But moments later he adds that for now the first, original model is the most accurate. It predicts the average price of Bitcoin in the current cycle at $55,000.
PlanB: Bitcoin will rise 100% by 2024
The analyst assumes that in the future Bitcoin will be 2 times more scarce than gold. If this happens at some point, the market value will also exceed the gold’s market value. As of this moment, gold’s market cap is around $10 trillion and is roughly 20 times larger than BTC.
PlanB notes that the Bitcoin price is currently reversing and approaching the values set by the model. He adds that every time a halving has occurred, the BTC price has reached exactly the values assumed by the original Stock-to-Flow model. Halving is indicated by a change in the color of monthly dots from blue to red.
If this repeats at the next halving, Bitcoin should approach the $55,000 – $60,000 range. This would equate to an increase in BTC of around 100% from today’s valuation.
According to the latest estimates, the next halving would take place on April 5, 2024. This would mean that Bitcoin would have to make around $30,000 in 12 months. Thus, the average monthly increase of the largest cryptocurrency should be $2500 / month.
For BeInCrypto’s previous Bitcoin (BTC) analysis, click here.
Disclaimer
In line with Trust Project guidelines, this price analysis article is intended for informational purposes only and should not be considered financial or investment advice. BeInCrypto is committed to accurate, objective reporting, but market conditions are subject to change without notice. Always do your own research and consult with a professional before making any financial decisions.

![Fintech companies facilitate the “high friction process” by buying a home [Video]](https://www.cryptoproductivity.org/wp-content/uploads/2022/07/4a422bd0b4fedf29dec1d79062c8da96.jpeg "Fintech companies facilitate the “high friction process” by buying a home [Video]")
