Bitcoin (BTC) prices stumble into technical support ahead of FOMC
Bitcoin (BTC/USD) News and Analysis:
- Bitcoin (BTC) prices fall to significant support at $20500
- BTC/USD is struggling to clear technical levels of support and resistance
- USD strength remains a prominent threat for speculative assets
Recommended by Tammy Da Costa
Get your free USD forecast
Bitcoin Prices, Fed Rate Decision and Geopolitics – What’s Driving the Markets?
It’s been almost a year since Federal Reserve Governor Jerome Powell removed the word “transient” from the inflation narrative and Bitcoin hit a record high of $69,000. Although the low-interest rate environment was favorable for cryptocurrency throughout last year, a significant change in the geopolitical backdrop has huge challenges for speculative assets in 2022.
Basic business knowledge
Macro basics
Recommended by Tammy Da Costa
With the Fed rate decision on the horizon, a fourth consecutive increase of 75 basis points is expected to be announced tomorrow as the BoE (Bank of England) prepares for its rate decision on Thursday. Although fundamentals continue to be priced in, Friday’s non-farm payrolls (NFP) report could provide an additional catalyst for price action as investors continue to look for signs of a potential Fed pivot (when the Federal Reserve will begin slowing reduce the pace of interest rate increases).
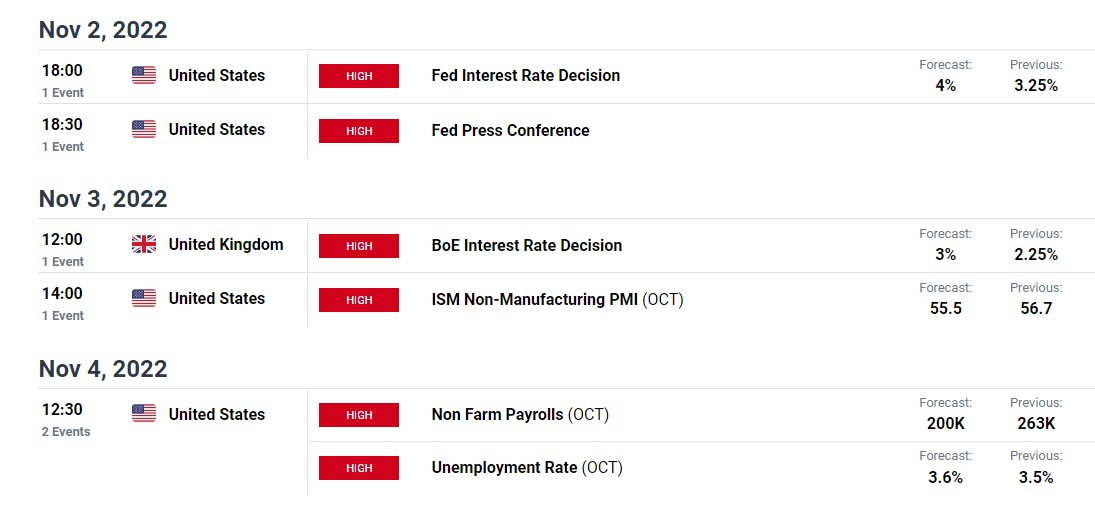
DailyFX Financial Calendar
Currency traders can monitor central bank announcements viathe central bank’s calendar
Bitcoin (BTC/USD) Technical Analysis
Although macro fundamentals remain the prominent driver of price action, the steep selloff in Bitcoin was temporarily dampened after BTC/USD fell to a low of $17592.78 in June. As prices have limited movement, a failure to break above $25,212 in August pushed the native cryptocurrency into a well-defined range that continues to hold.
Recommended by Tammy Da Costa
Get your free Bitcoin forecast
As the 78.6% Fibonacci retracement of the 2020 – 2021 move provides additional support for the long-term trend around $17792, the September high has formed an additional resistance zone at $22781.
Bitcoin (BTC/USD) Weekly Chart
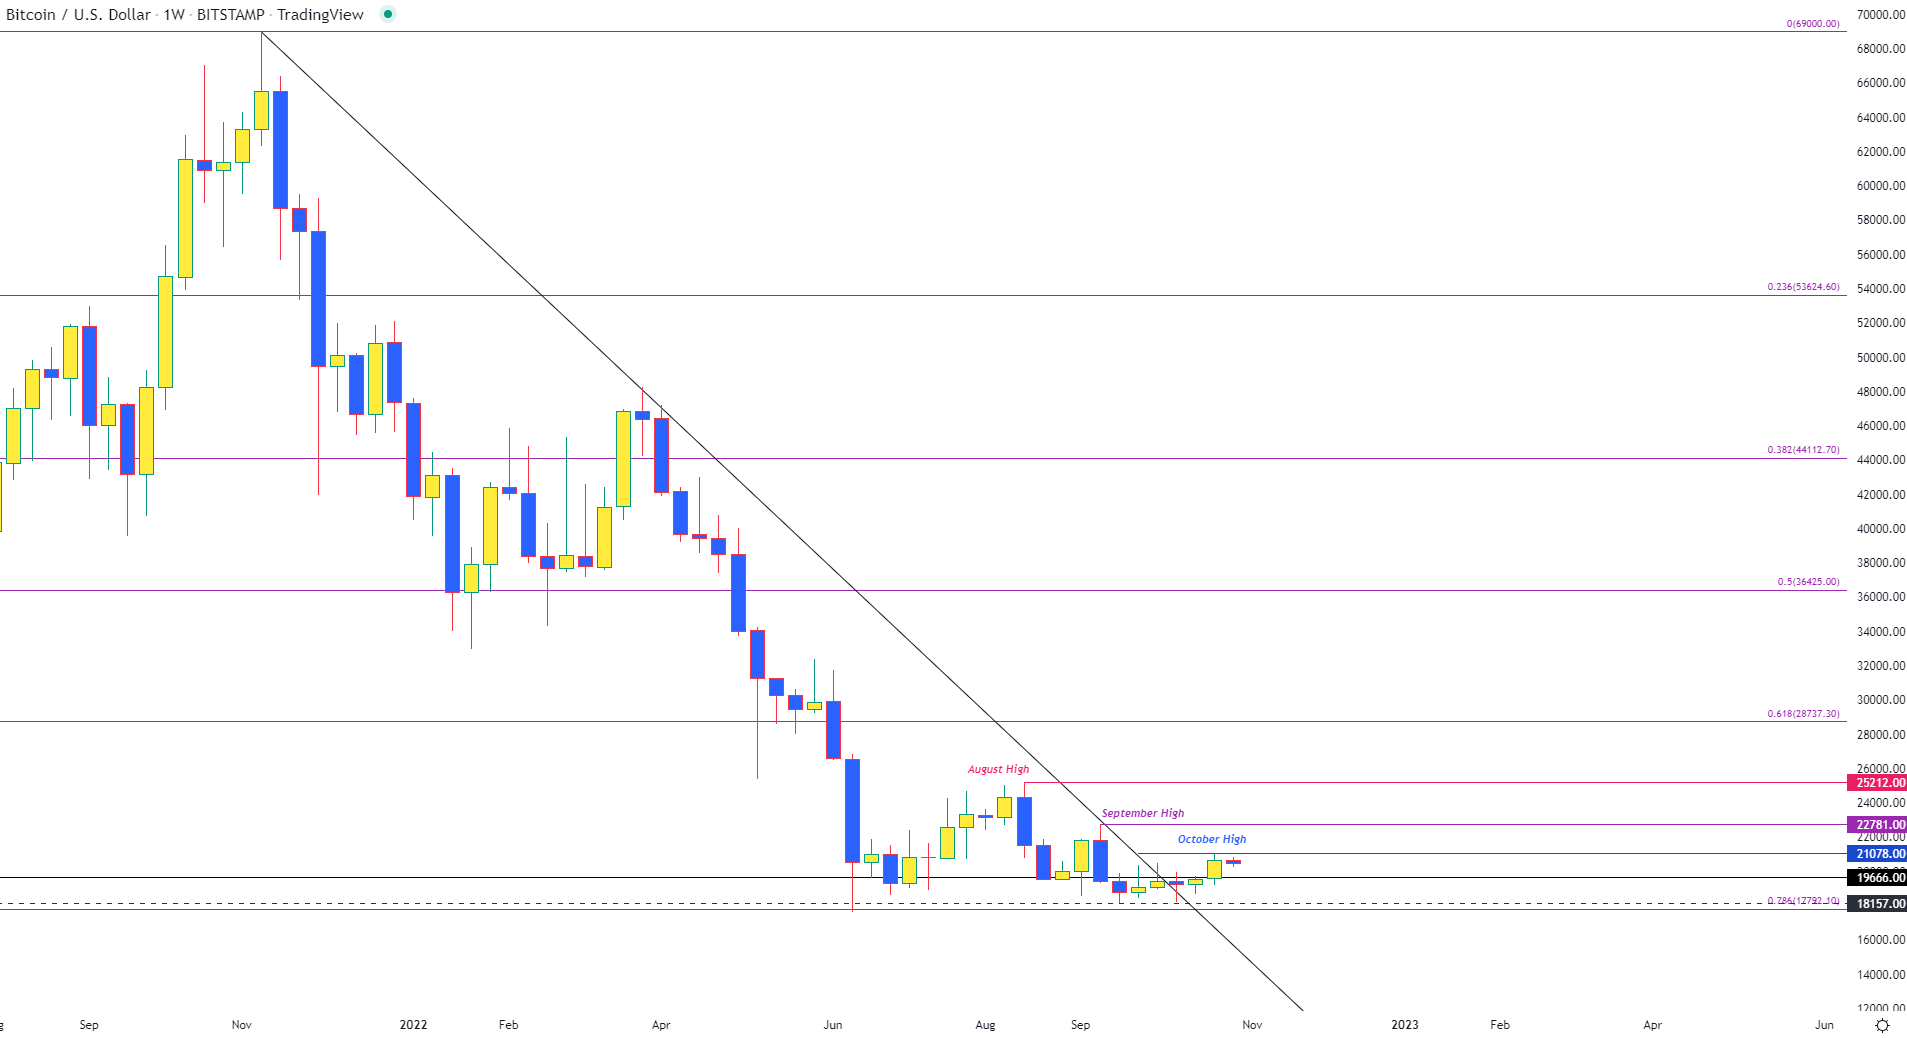
Chart prepared by Tammy DaCosta using TradingView
With the October high now holding as imminent resistance at $21078, a new layer of horizontal support has formed around the $20500 mark. While technical and psychological levels help establish firm levels of support and resistance, a clear breach of the above levels may be necessary for either bulls or bears to gain momentum. If prices fall below $20,000, the next support zone remains at the December 2017 high at $19666 with a break below bringing the September low back into focus at $18157, which could allow for bearish continuation and a potential retest of the June low at $17792 .
Bitcoin (BTC/USD) Daily Chart
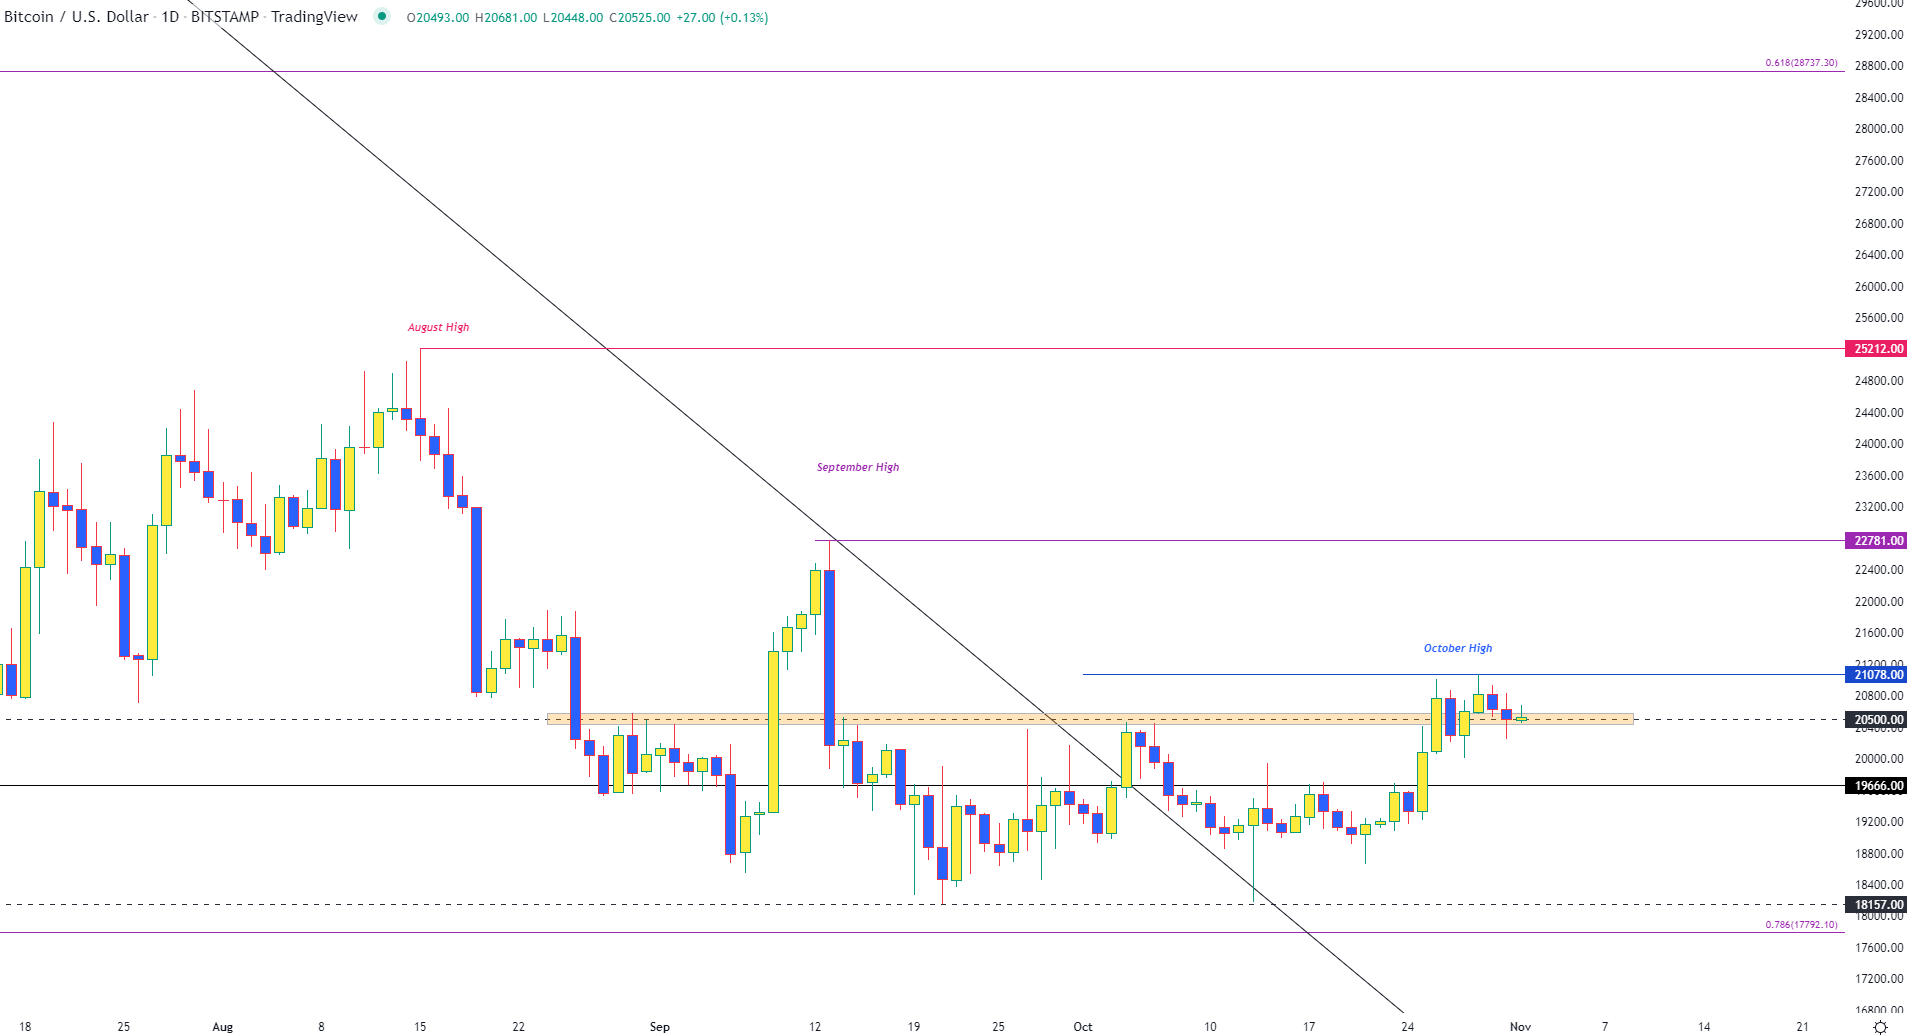
Chart prepared by Tammy DaCosta using TradingView
However, if BTC is able to rise above $21072, a retest of the September high ($22781) could see Bitcoin prices rally back towards the next resistance barrier at the August high of $25212.
Trade smarter – Sign up for the DailyFX newsletter
Receive timely and compelling market commentary from the DailyFX team
subscribe to newsletter
— Posted by Tammy Da Costa, Analyst for DailyFX.com
Contact and follow Tammy on Twitter: @Tams707


