Bitcoin (BTC) price may fall towards $20,000
Bitcoin (BTC) price broke from a rising support line that had been in place since the beginning of the year. This bearish development could be the beginning of a significant decline for Bitcoin.
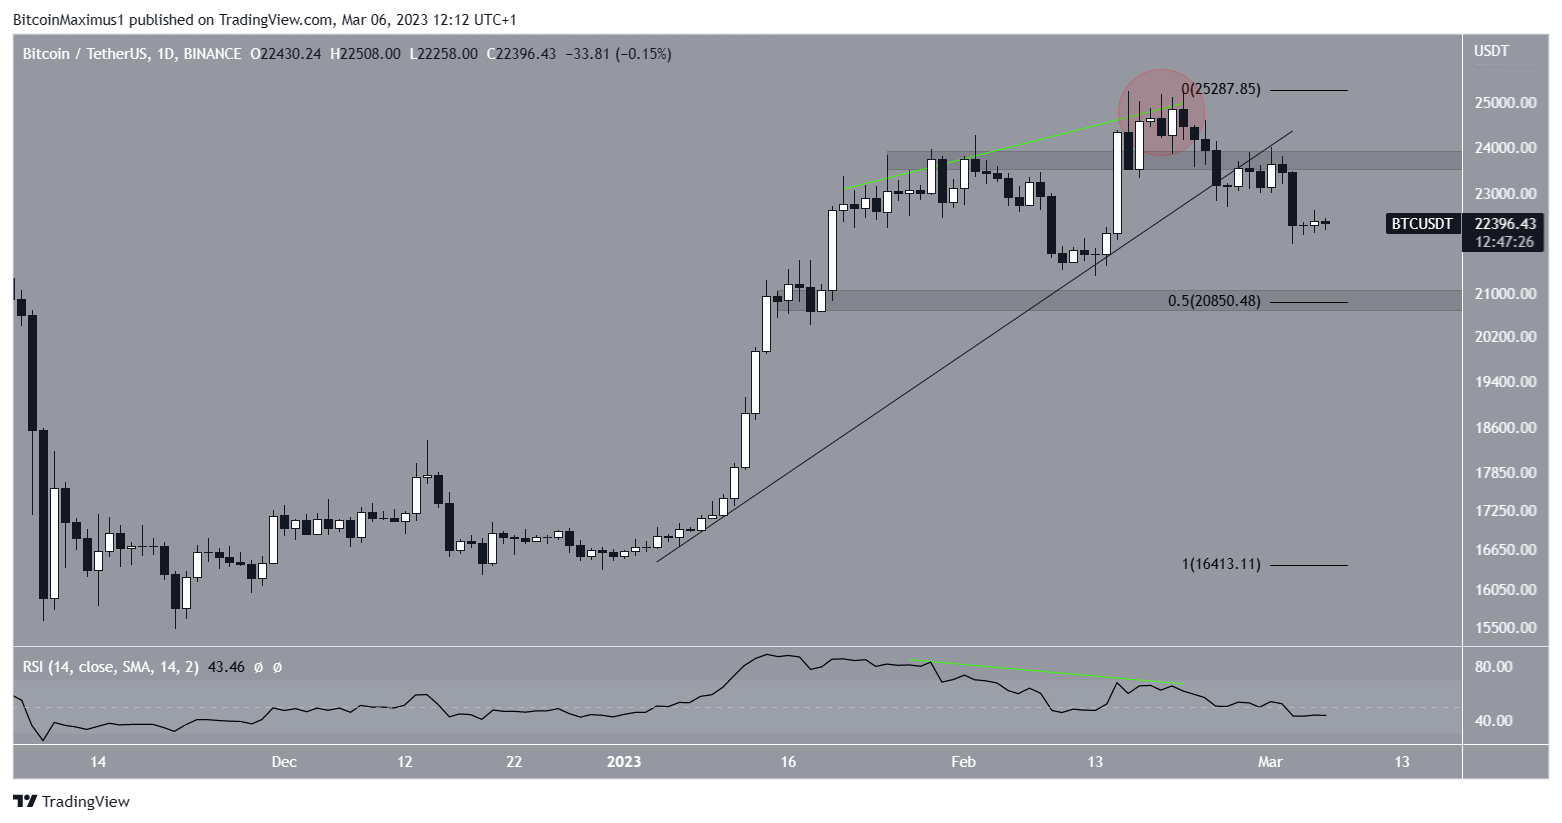
Bitcoin price history since the annual high of $25,250 on February 25 is bearish. There are three main reasons for this:
First, the BTC price deviated above the $23,800 resistance area (red circle). Such deviations are considered bearish developments, and lead to bearish trend reversals most of the time.
Bitcoin (BTC) price is sending bearish signals
Second, the divergence was preceded by a significant bearish divergence in the daily RSI (green line). The RSI is now below 50, another bearish sign.
Finally, BTC broke down from a rising support line, indicating that the upward movement is finished.
If the decline continues, the nearest support is at $20,850, created by the 0.5 Fib retracement support level and a horizontal support area. This is the most likely scenario.
However, regaining the $23,800 resistance will invalidate this bearish BTC outlook. That could lead to peaks near $27,000.
Bitcoin Dominance Rate (BTCD) stumbles over resistance
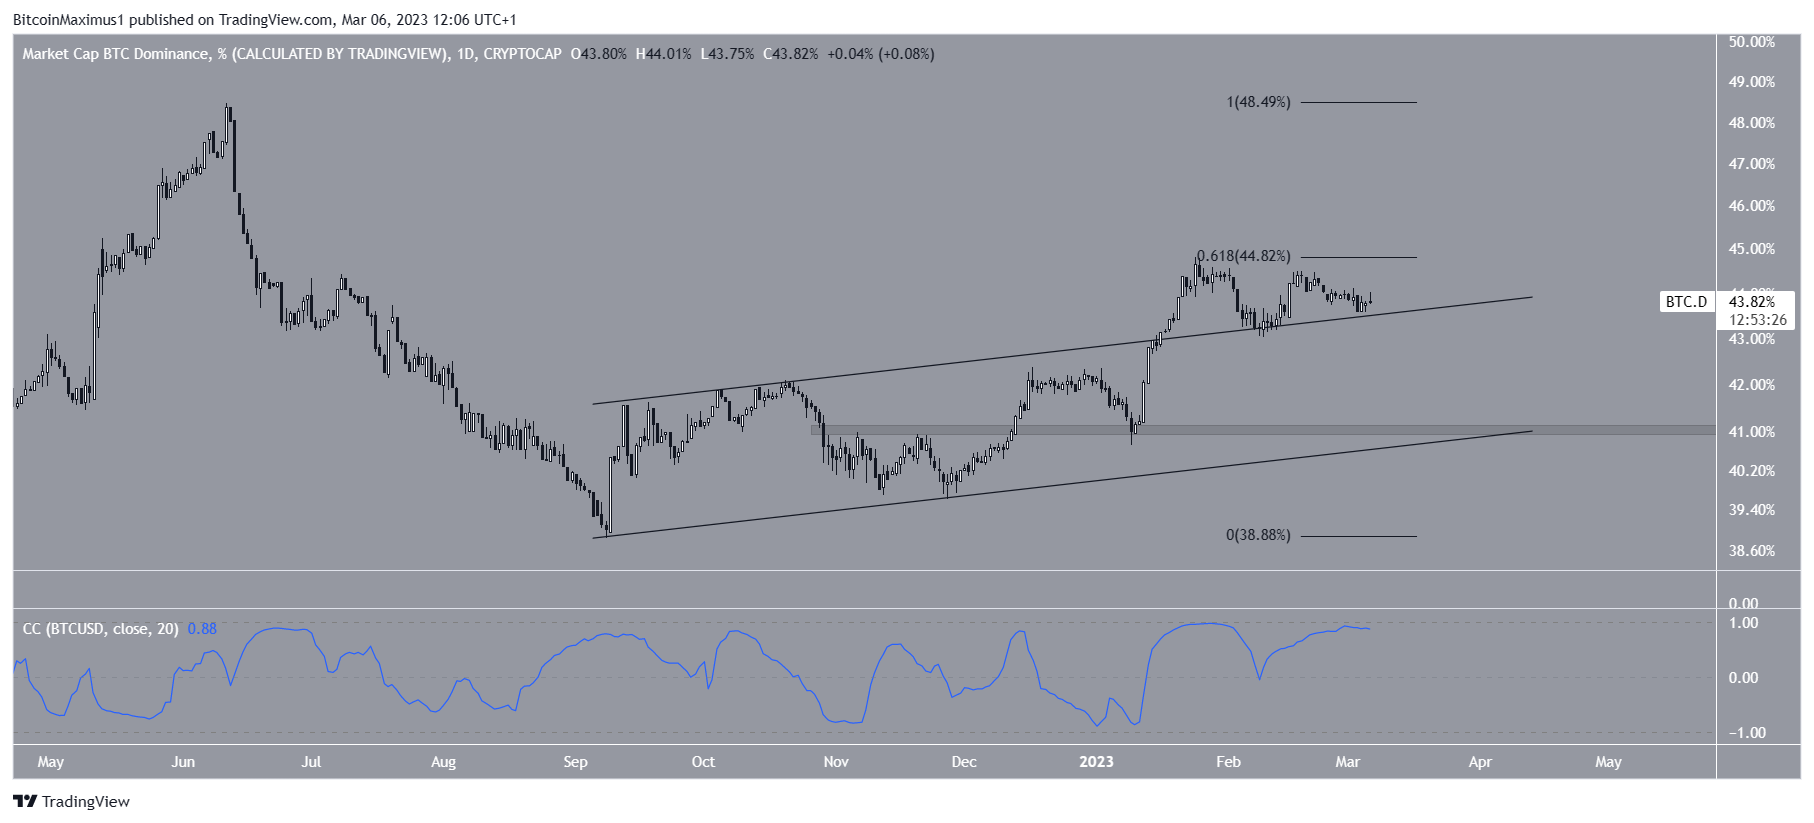
BTCD broke out of a rising parallel channel on January 17. It reached a high of 44.79% eight days later. However, it was rejected by the 0.618 Fib retracement resistance level and has since declined. Currently, BTCD is barely hanging on the channel resistance line.
If BTCD bounces and breaks out above the 0.618 Fib resistance, it could rise to 48.50%. However, if it falls back within the confines of the channel, a drop to the channel’s 41% support line would be the most likely scenario.
BTCD and Bitcoin price have an almost perfect correlation (blue). This means that an increase in one leads to an increase in the other and vice versa.
Since the most likely BTC price forecast is a fall, this would also fit with a BTCD decline.
To conclude, the most likely BTC price outlook is a fall towards the $20,850 confluence of support levels. A close above $23,800 would invalidate this bearish scenario and could lead to a rise towards $27,000.
For BeInCrypto’s latest crypto market analysis, click here.
Sponsored
Sponsored
Disclaimer
BeInCrypto strives to provide accurate and up-to-date information, but it will not be responsible for missing facts or inaccurate information. You comply and understand that you should use all such information at your own risk. Cryptocurrencies are highly volatile financial assets, so do your research and make your own financial decisions.

