Bitcoin aSOPR fails retest of historic Bull-Bear Junction
On-chain data shows that the Bitcoin aSOPR indicator has found resistance at the historic intersection between bull and bear markets.
Bitcoin aSOPR fails retest of “Value=1” line
As pointed out by an analyst in a CryptoQuant post, BTC aSOPR has recently been rejected from the breakeven mark.
“Spent Output Profit Ratio” (or SOPR for short) is an indicator that tells us whether Bitcoin investors are selling at a loss or a profit right now.
The metric works by looking at the chain of each coin being sold to see what price it was last moved to.
If the previous sale price of a coin was less than the current value of BTC, that coin has just been sold at a profit. Whereas if it is different then the coin realized some loss.
A modified version of this indicator, “Adjusted SOPR” (aSOPR), excludes from its calculations all those coins that were held for less than 1 hour before being sold. The advantage of this modification is that it removes any noise from the data that would not have had any significant implications on the market.
Now, here is a chart showing the trend of Bitcoin aSOPR over the last few years:
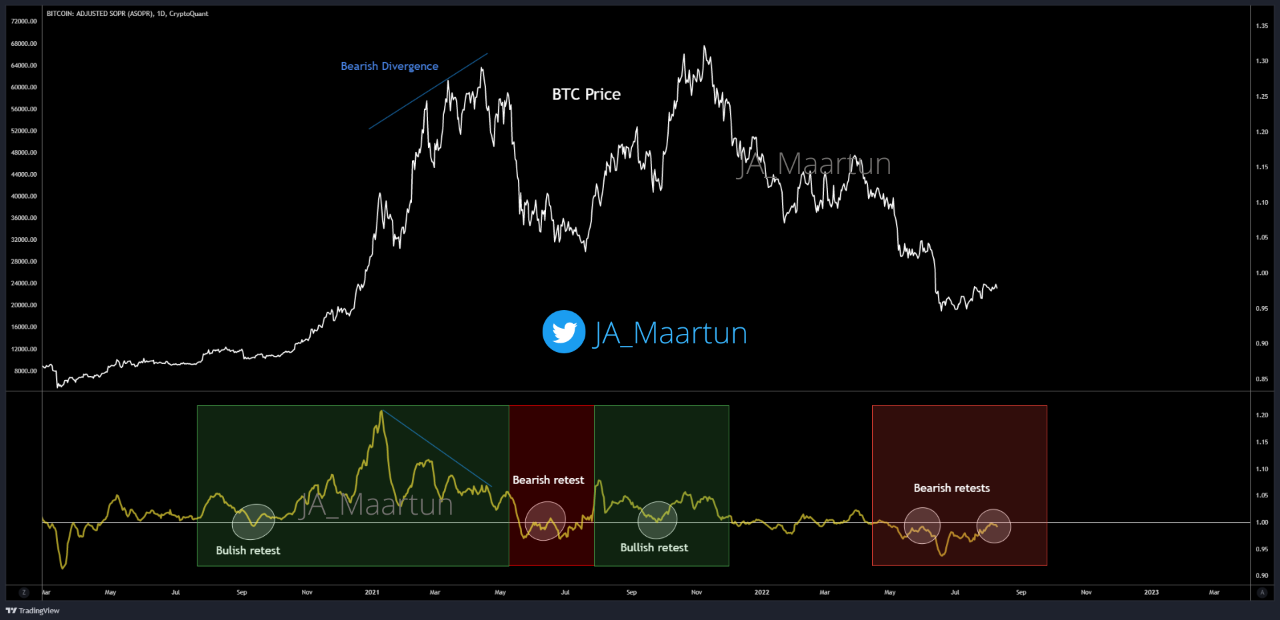
Looks like the value of the metric has been below one in recent days | Source: CryptoQuant
When the value of aSOPR is greater than one, it means that the average investor is selling at a profit right now. On the other hand, the metric lower than the threshold suggests that the overall market is moving coins at a loss.
As you can see in the graph above, the analyst has marked the relevant trend zones for Bitcoin aSOPR.
It appears that during bull markets the “1” value of the metric has acted as support, while during bears it has provided resistance.
The significance of this line is that it is the breakeven mark for investors, since owners of this value only break even when they sell.
Under bulls, investors think of this line as a good buying opportunity, but with bears, they see it as an ideal selling point.
Recently, aSOPR attempted a retest of this mark, but it was rejected back into the loss zone. If the historical pattern is anything to go by, this current trend would mean that Bitcoin is still stuck in a bear market.
BTC price
At the time of writing, Bitcoin’s price is hovering around $24.5k, up 7% in the last week.

The value of the crypto has surged up during the past day | Source: BTCUSD on TradingView
Featured image from Peter Neumann on Unsplash.com, charts from TradingView.com, CryptoQuant.com


