Bearish macro outlook for Bitcoin prices won’t stop BTC bulls from scalping corrective rally
- Bitcoin price shows a bearish outlook on a three-day chart with targets ranging from $13,575 to $11,898.
- Lower time frame analysis shows that BTC is poised to trigger a recovery rally attempt to retest $17,251.
- A reversal of the $17,593 barrier to a support level would question the bears’ authority and could trigger a bullish move.
Bitcoin price has broken a stable support level that has prevented a collapse for the past four months. This development has knocked BTC down to test some not-so-good footholds that could trigger a further crash in market cap for the major crypto holders.
Bitcoin price is still indecisive
Bitcoin price fell below the June 18 support level of $17,593 on November 8. This collapse was a result of the FTX exchange’s dilemma, which eventually led to bankruptcy. Although problems for the Bahama-based platform began on November 2, the situation worsened in the coming days.
This caused the crypto market to fall and the Bitcoin price turned the $17,593 support into a resistance level. When BTC auctions at $16,000, investors need to pay attention to $15,551, which is a decent support zone and was formed about two years ago.
A failure to hold above this level will further push the Bitcoin price to the subsequent foothold at $13,575, which is also relatively weak, especially compared to $11,898.
Therefore, from a macro perspective, a bear market bottom could occur anywhere between $11,898 and $13,575. So investors must be wary of Bitcoin price’s short-term returns and not be lured by it.
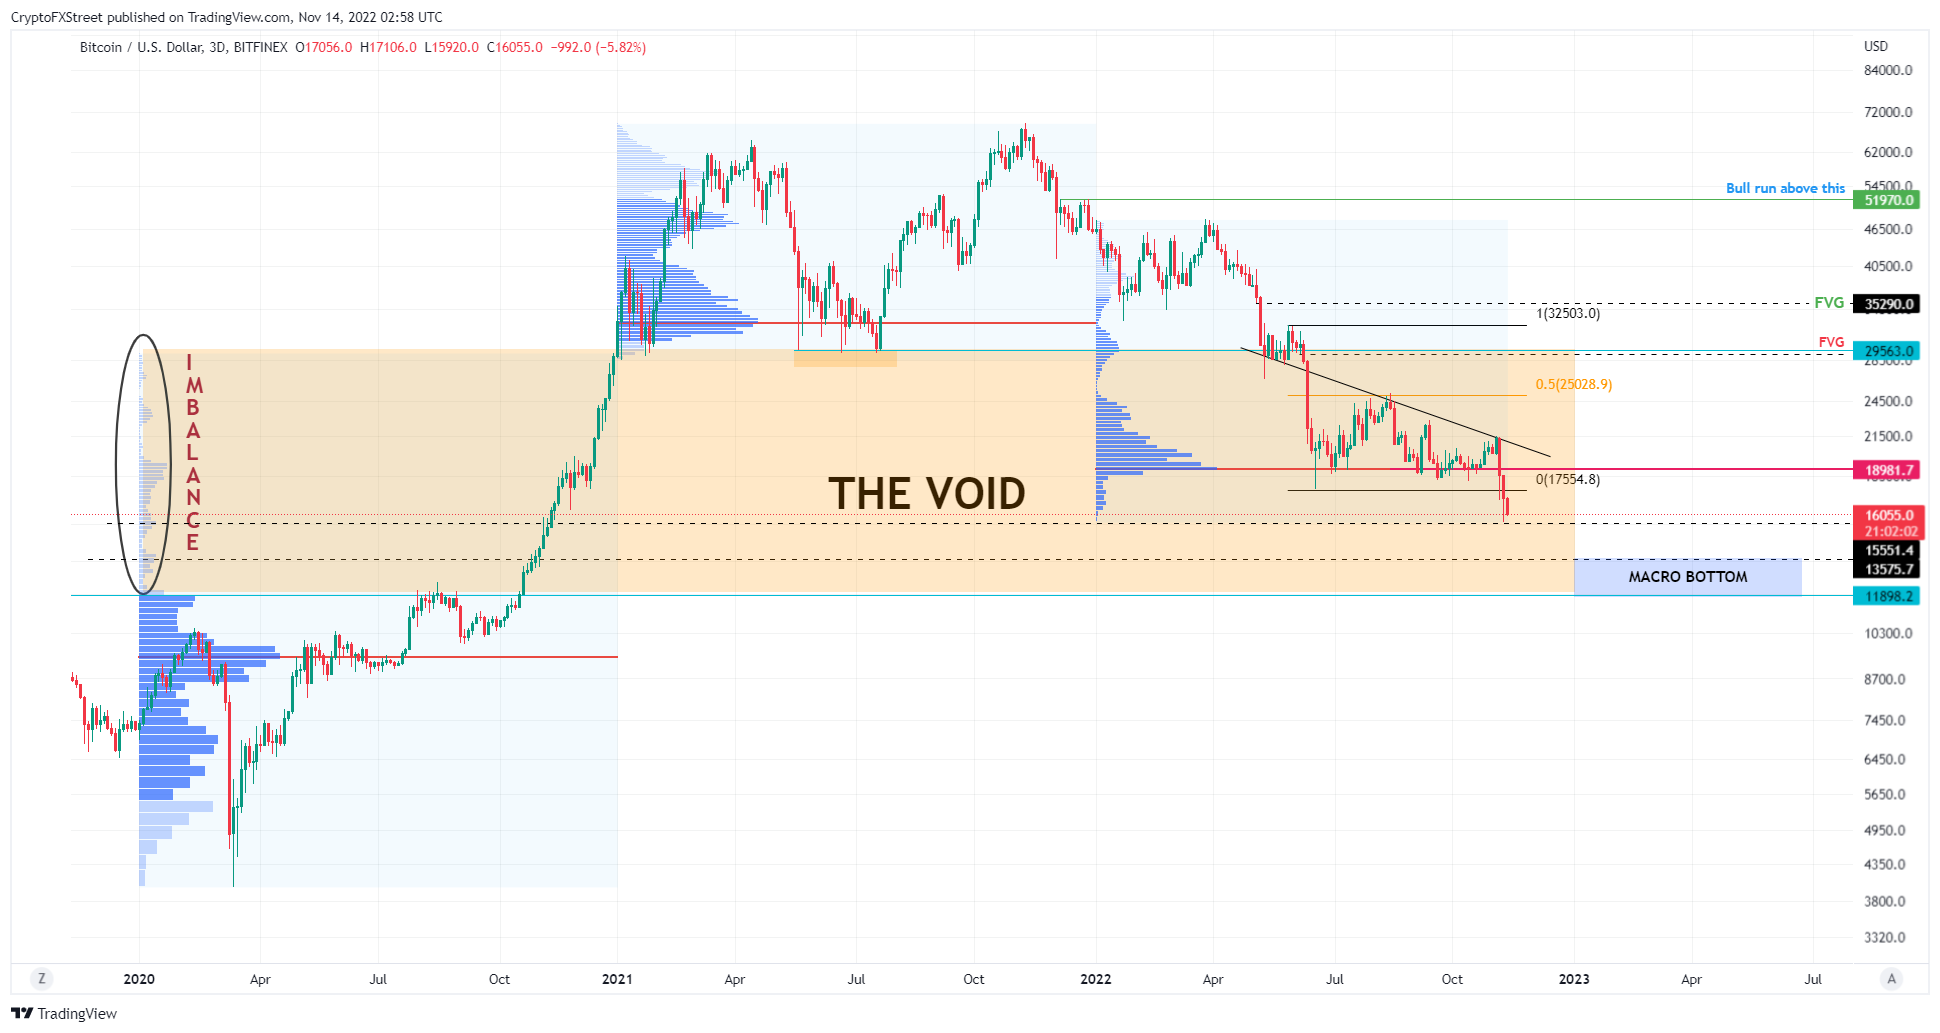
BTCUSDT 3-Day Chart
Although the Asian session does not have a bullish start, the London or New York sessions could result in an increase in buying pressure. Therefore, investors must be wary of intra-day Bitcoin price movements for scalping opportunities.
On the one-hour chart, investors can see Bitcoin price hovering above a 30-minute demand zone, ranging from $15,550 to $15,924. A pullback from this level could be the key to triggering an 8% rally that tests the inefficiency known as the Fair Value Gap (FVG) at $17,251.
Just a reversal of the $17,593 barrier would invalidate the bearish bias and extend this rally’s target from $17,251 to $19,500.
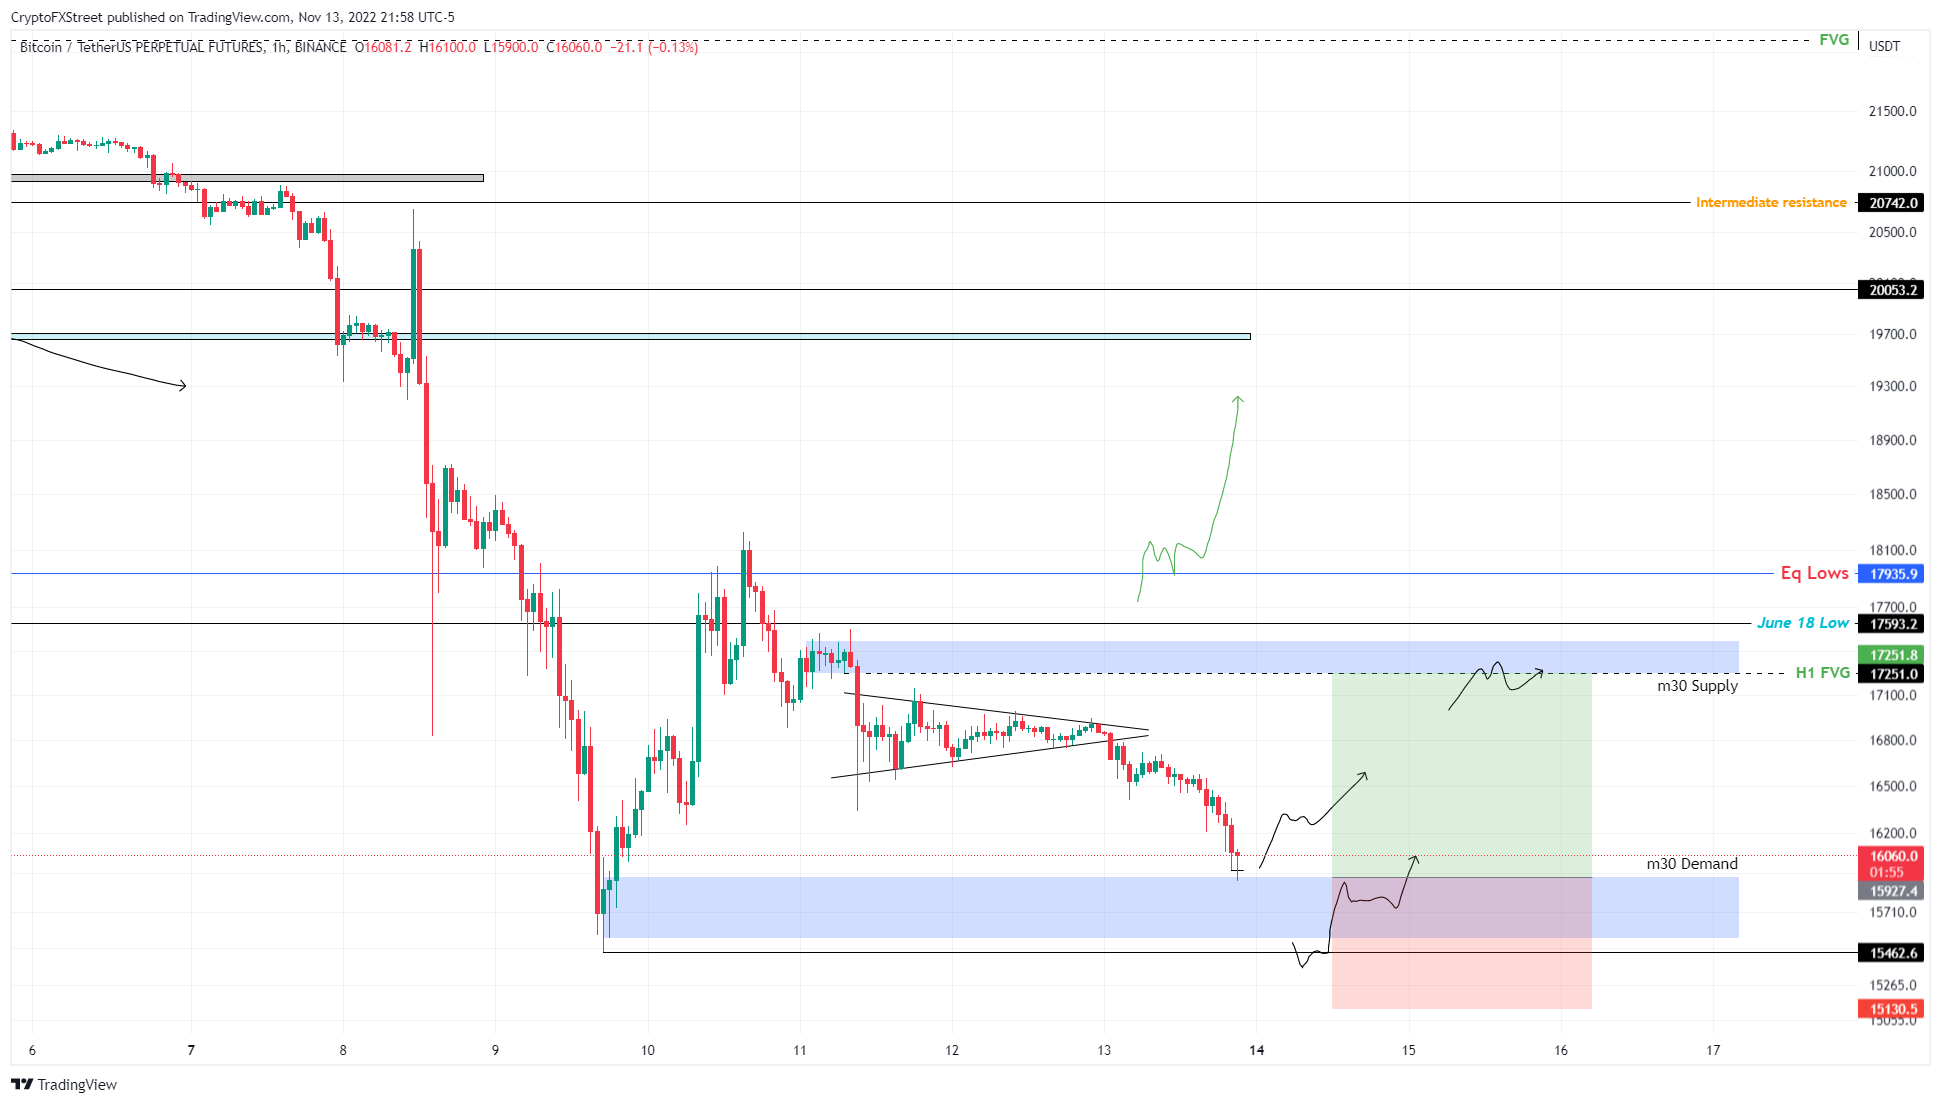
BTCUSD 1 hour chart
Although things look bearish in the long term, a reversal of the $17,593 level would be the start of a rally. This development will also invalidate the bullish thesis and potentially trigger a run to the $25,000 psychological level.


