Analysis crypto of Stellar, Litecoin, Mina
Important crypto news and price and performance updates at Stellar (XLM), Litecoin (LTC) and Mina (MINA).
Focus on crypto assets Stellar, Litecoin and Mina
It is worth recalling that Stellar is an open source currency exchange protocol founded in early 2014.
Litecoin is a peer-to-peer cryptocurrency and an open source software project.
Finally, Mina is a “minimal blockchain” built to reduce computational requirements to run dApps more efficiently.
Stellar (XLM) crypto shows a bearish trend: significantly worse than the trend of Litecoin and Mina
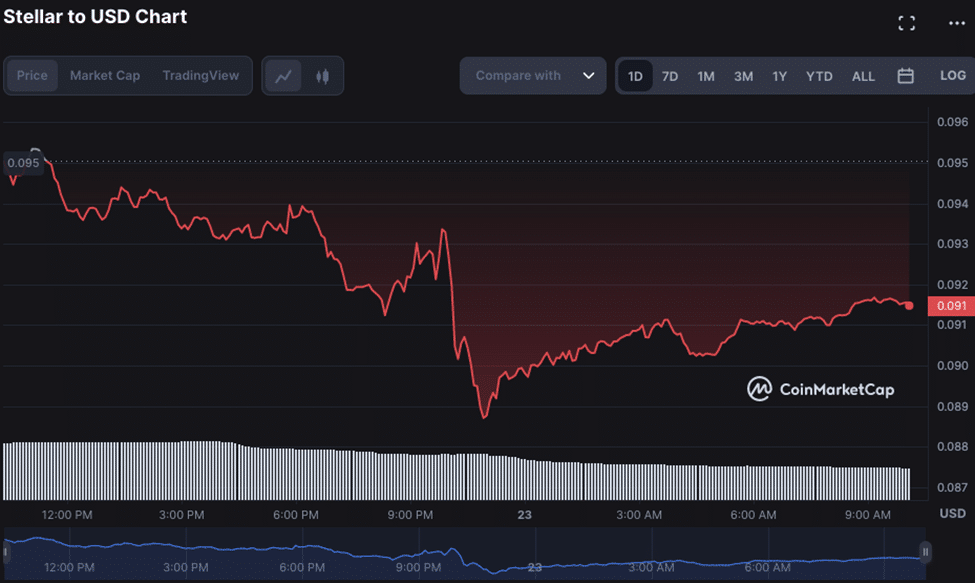
The price analysis of Stellar (XLM) shows that the bearish momentum has taken over the market. Selling pressure is increasing on the XLM market and prices are falling to lower levels.
In fact, the Stellar token is trading near $0.0914 and has lost 3.26% in the last 24 hours. The past few days have been supportive for bullish traders after the price of XLM rose to highs near $0.095 and tested resistance at $0.09536 when buyers pushed the price higher.
But today the bears took over and the price of XLM fell below the $0.095 level. If this bearish pressure continues, we could see a deeper correction that will bring the XLM/USD pair closer $0.08871 support level.
On the upside, on the other hand, if the bulls manage to push prices higher and break through the current resistance at $0.09536, then we could see a further price rally with the possibility of testing the next resistance at $0.10 levels again.
In addition, 24-hour trading volume for XLM/USD has decreased to 129 million dollars and remains well below previous levels, indicating that investors are reluctant to trade due to bearish market sentiment.
The market capitalization of the XLM token has also fallen to $2.47 billion, down more than 3% in the last 24 hours, placing it in 28th place on CoinMarketCap. Not only that, daily technical indicators for the XLM/USD pair remain bearish and indicate further downward momentum.
The stochastic RSI indicator is in neutral territory and stands at 57.82. However, if bearishness persists, we could see the Stochastic RSI move towards oversold territory. MACD is in bearish mode and has crossed the signal line, indicating further downward momentum.

Litecoin outperforms Bitcoin and jumps to the top of social rankings
Litecoin (LTC) diverged from the broader market decline after the Fed’s decision ended in a rate hike.
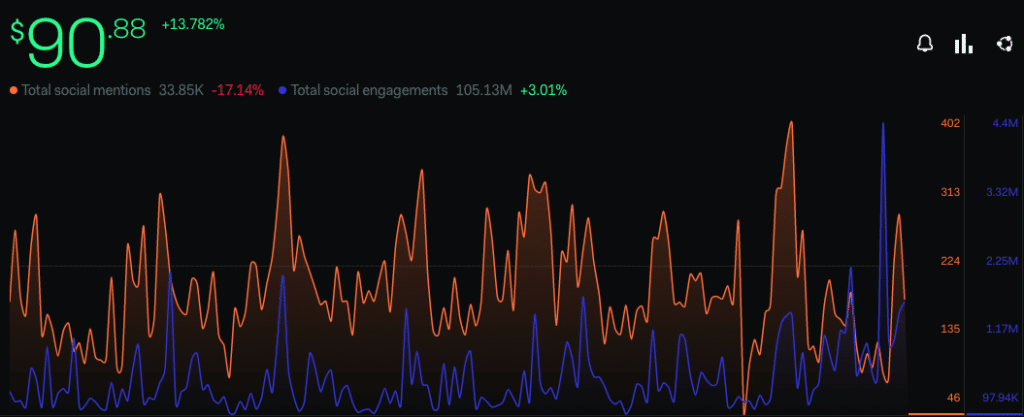
The decision may have had a negative impact Bitcoin (BTC) and many others instead, but LTC was able to identify a 13.78% increase as its own aftermath.
Normally, a circumstance like this would be the result of significant development around a project. However, this was not the case with the cryptocurrency’s native low-cost blockchain payment network.
In fact, regardless of the silence of updates, LunarCrush signaled that no other coin matched LTC in terms of social and market activity. At the moment, social engagements peaked at 29,819,175 while mentions were 4,467.
Being at the top of the ranking therefore means that LTC enjoyed an excellent status in terms of financial, community and market values. It has also been suggested that investors viewed the currency as promising in the short term.
While LTC may have gained investor confidence and outperformed BTC, the next course of action may be to pay attention. This was due to the condition of the chain as shown by market value to realized value (MVRV).

The calculation acts as an outstanding indicator to identify high and low market cycles halved and also indicates when an asset is undervalued or not. At press time, the 365-day MVRV ratio was 25.95%.
Long-term owners may be significantly unfazed by this position, as LTC’s price was down 82.56% from its ATH.
However, the increase in the metric may not be the same for investors looking for quick gains as it suggested that LTC may be overvalued.
Also, the long/short MVRV difference appeared to be consistent with the position of the relationship. At the moment, the metric was 19.85%. Since it was not on the negative axis, it means that short-term realized gains may decline soon.
Focus on the price change at Mina
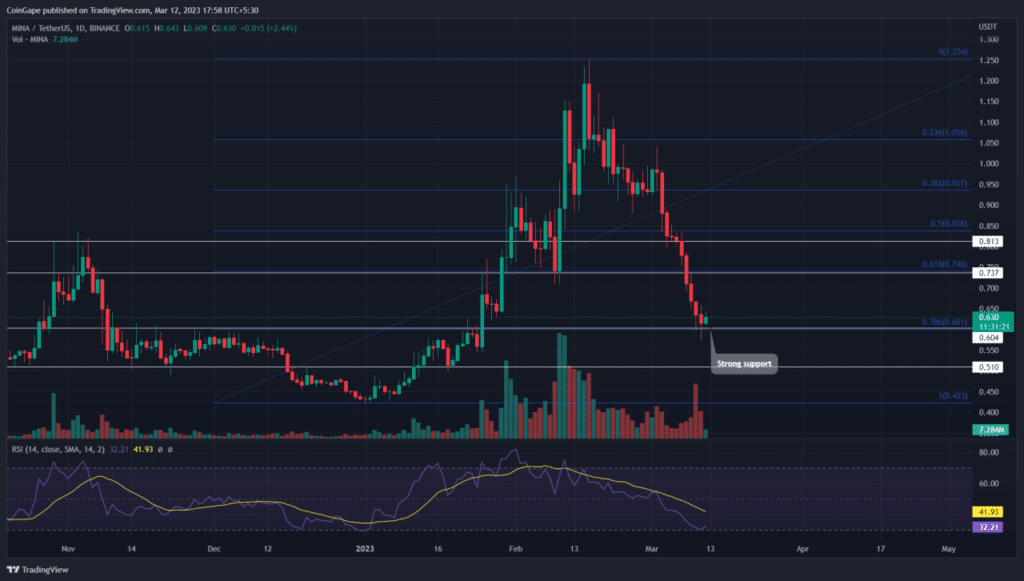
MINEits ongoing price correction has fallen 53% in one month. The V-top reversal all but evaporated the gains of January and mid-February and sent prices to a Fibonacci low at the 0.786 level.
However, the price of the coin then returned to 0.786 FIB support at $0.6 and triggered a bullish reversal. The course on MINA is currently traded at $0.6366which shows an increase of 6.2% from previously.
If the buying persists, buyers can retest the resistance to $0.737 and $0.8.

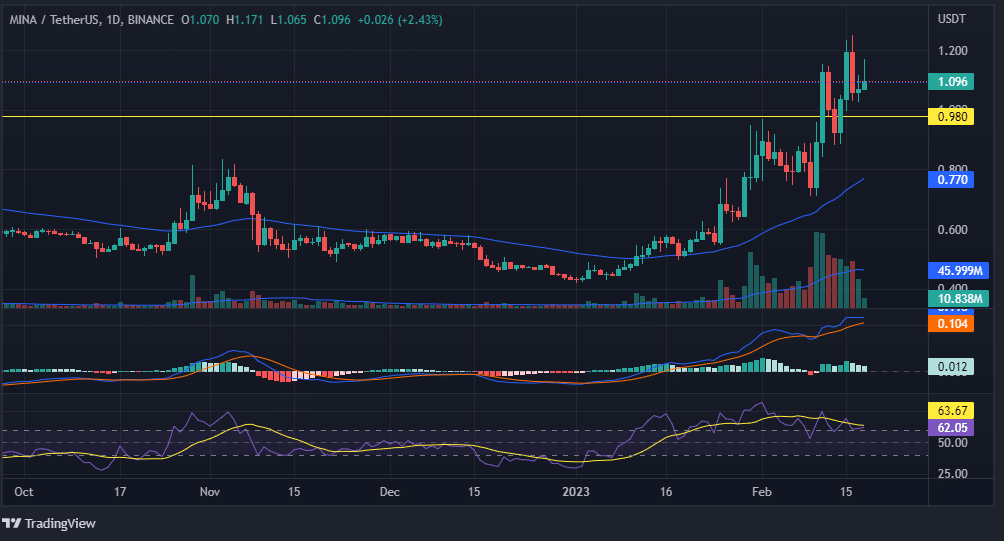
Furthermore, about a month ago, investors on MINA’s daily chart could clearly see that the currency, after taking a big drop, moved into a sideways trend for a long time.
You may also have noticed that the coin recently showed a big bullish rally from the main support level, i.e. from around $0.427. During its bullish rally, it also crossed one of its own key opponent.
Apart from that, a Golden Crossover is about to happen on the chart, which could push the currency’s prices even higher. The MACD indicator has shown a bullish crossover, suggesting that the bulls have outnumbered the bears.
This transition also means that investors can now see an increase in currency prices. However, the RSI curve is trading at 62.05, which is above the 50-point level.
The value of the RSI curve can be seen to increase even more in the future as coin prices rise. Therefore, it is clearly visible that both indicators, MACD and RSI, show a buy signal.