About 48% of Ethereum NFT trades in October were fake
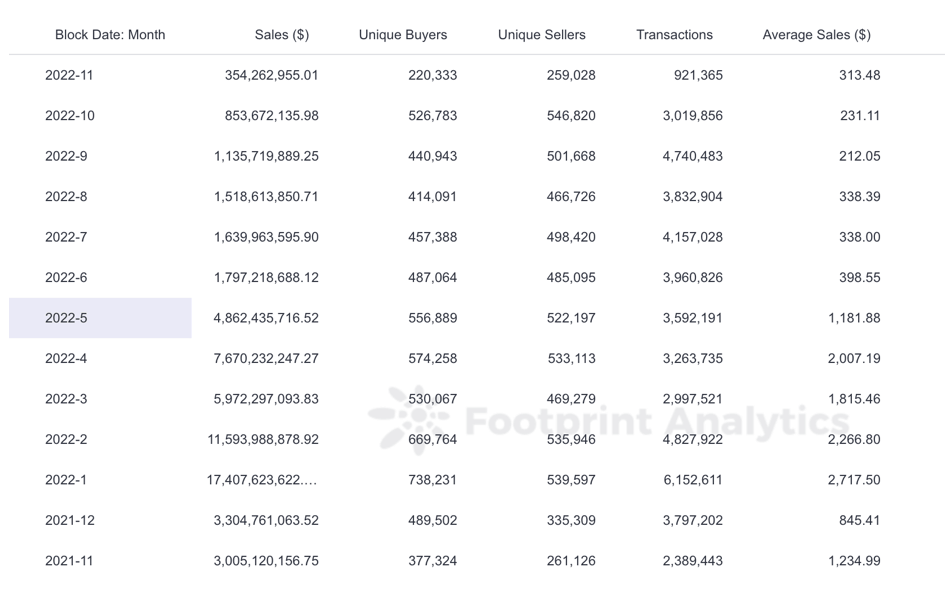
Global NFT sales in October clocked in at more than $850 million over approximately 3 million total transactions. I looked at NFT laundry trades last month and that research made me take a closer look at the numbers.
The trigger points for me to say that transactions are becoming more fraudulent are as follows:
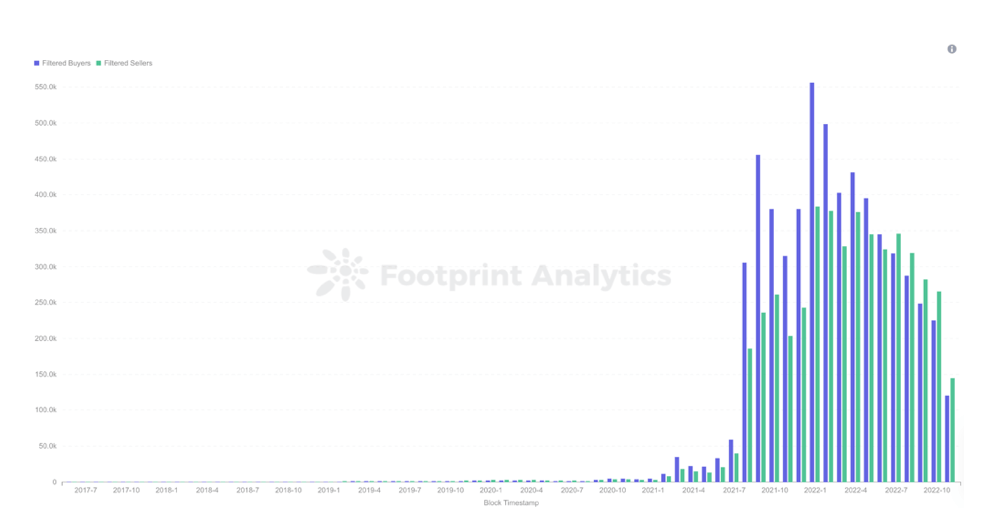
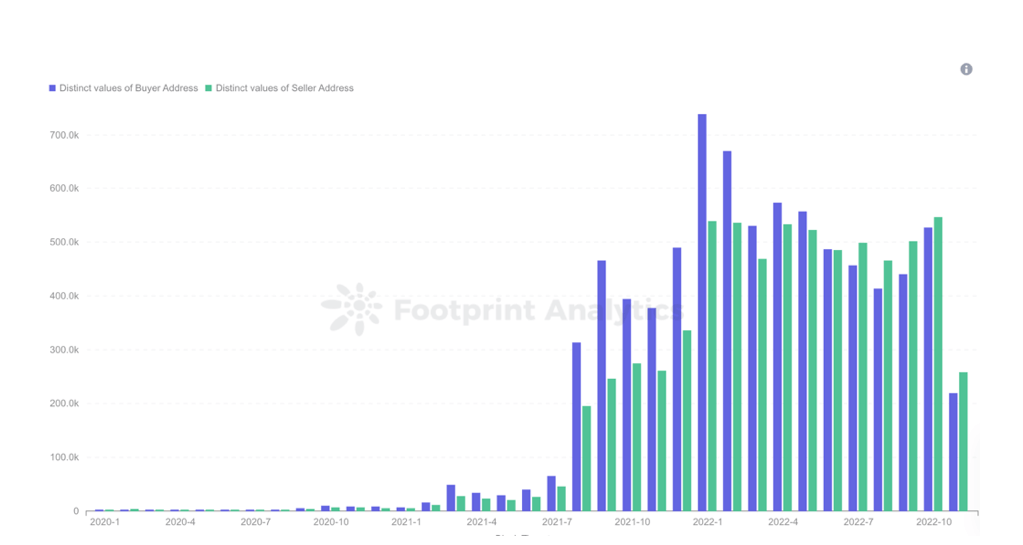
- Despite poor market conditions, we continue to see a high number of unique buyers and sellers. In October we had over 1 million unique buyers and sellers. Both buyers and sellers have increased compared to September.
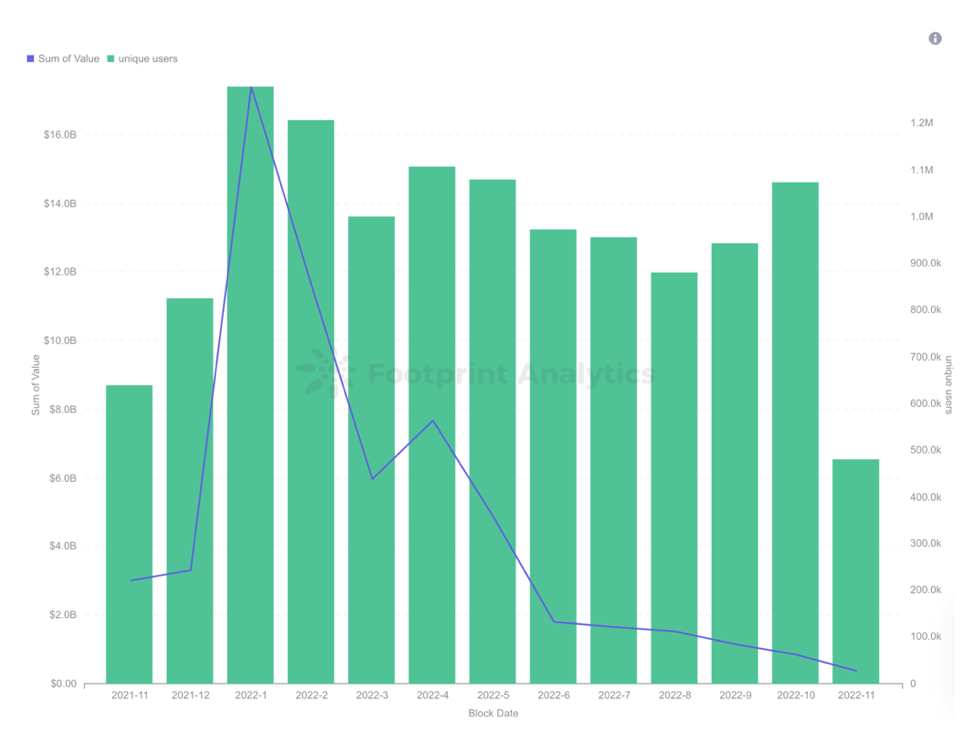
- The number of unique buyers and sellers appears to be inconsistent with growth in sales value and transactions. Around 1 million users contributed more than 4 million sales values in May compared to less than 250,000 in October. To me it seems unlikely to have an increasing market demand with less sales value transacted.
To look into this, I spoke to two centralized exchanges that operate NFT marketplaces. The exchanges said that around 80% of new buyers are holding NFTs in their wallets, rather than selling them. With the market so unfavorable, holding these assets seems to be the sensible move.
So where are all these unique buyers and sellers coming from? I spoke with Footprint Analytics and brought up my points. I realized that the statistics I am looking at are way too big. It involved several chains and it is difficult to track everything. We agreed to only work with Ethereum based marketplaces as an example to dive deep into since it is the most popular.
Here are the findings:
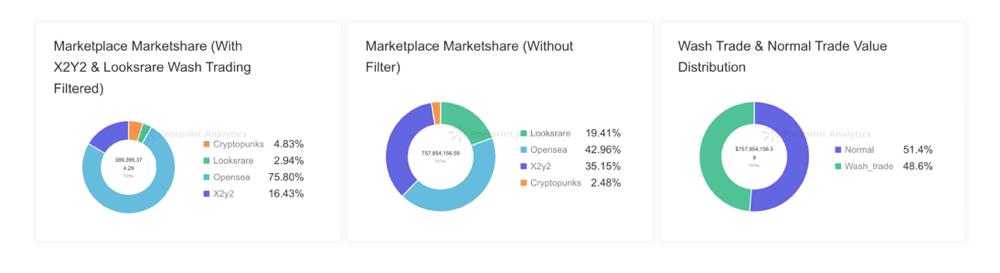
According to Footprint Analytics’ filters, wash trading accounts for almost half of all NFT trading volume.
Footprint Analytics – ETH NFT Market Overview (With Filtered Wash Trade)
Traders looking to artificially inflate the prices of pools or earn marketplace trading rewards generated $389 million in wash trades out of October’s total $758 million in NFT trading volume – bringing the amount of wash trading in the NFT market close to half of organic trading. The number of laundromat users makes up almost 46% of the total users.
Wash trading is a form of market manipulation where an investor simultaneously sells and buys the same financial instruments to create misleading, artificial activity in the market. It creates huge dissonance in the NFT industry between what most people think NFT trading is, i.e. someone buying an NFT for speculation, and the behavior that actually underpins the market – hundreds of insiders transferring NFTs between their own wallets.
There are several indicators to identify suspicious trading activity.
Signals and indicators include:
- Overpriced NFT trades with 0% creator fees
- Specific NFT IDs that are purchased more than a normal number of times in a day
- NFTs purchased by the same buyer address within a short period of time
The incentives for wash trading are to earn platform rewards and to create the appearance of value or liquidity for assets. Because there is no way to prevent or counter wash trading in the NFT market today, people have a huge misconception of the amount of organic, genuine trading activity in the industry.
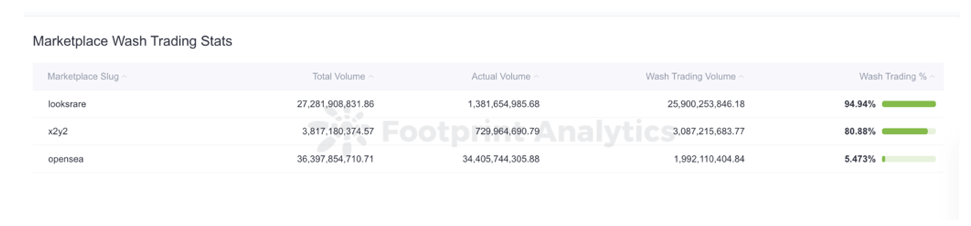
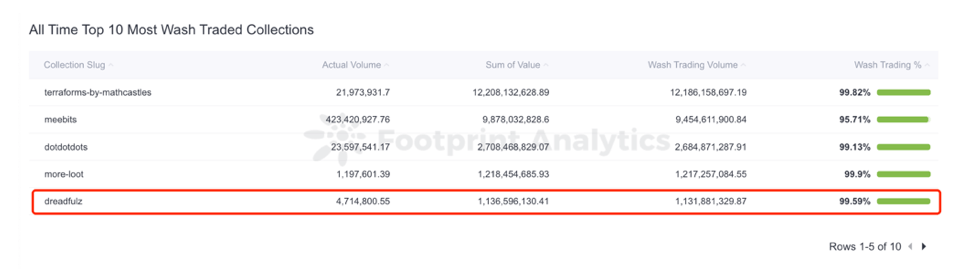
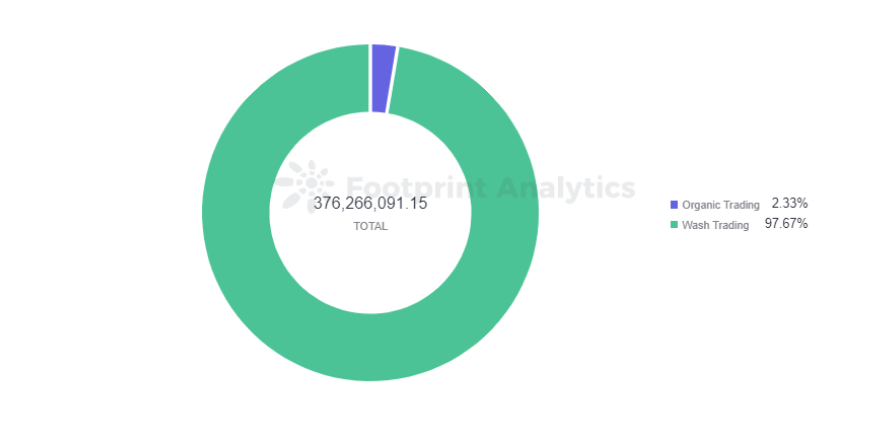
For example, 81% percent of all trades on X2Y2, one of the top 3 NFT marketplaces, were wash trades according to filters used. The main reason for X2Y2 wash trading is volume based daily trading rewards. The greater percentage of volume a user contributes to X2Y2, the greater proportion of daily trading rewards the user will earn. A similar division can be observed when looking at individual collections. For example, of Dreadfulz’s $1.1 billion total volume, $1.131 billion was flagged as a laundromat.
An analyst or writer who does not understand these laundry trade dynamics risks grossly misunderstanding the current market. For example, here’s what Business2Community wrote on October 12 about Terraforms by Mathcastles:
“Non-fungible token collections continue to show strong resilience amid the current general downturn in the crypto market so far this year. Here are some of the top-selling NFT collections this week: 1. Terraforms Reclaim The Top Spot. Terraforms, a Collection of non-fungible tokens (NFTs) from Mathcastles, has regained the top spot after flipping under our top ten bestseller list last week.Terraforms has a 24-hour trading volume of 1,814 ETH.
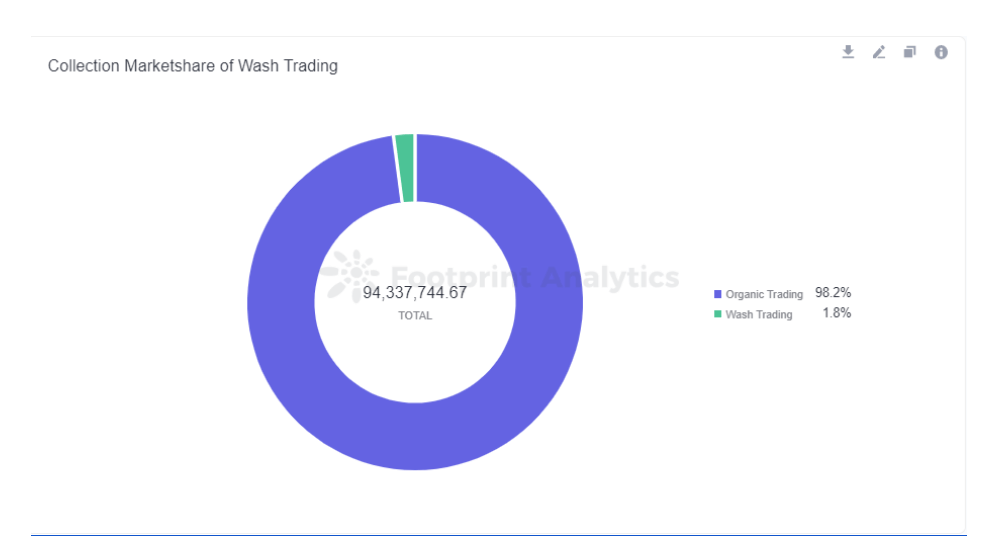
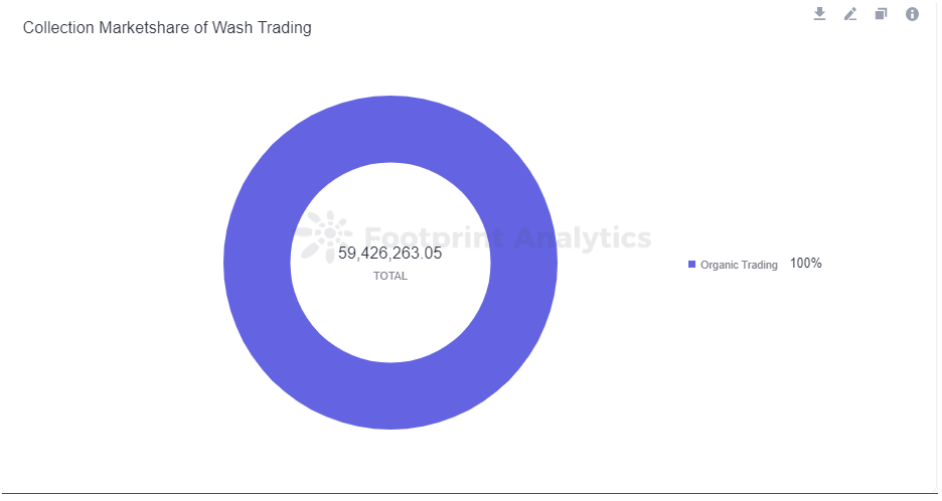
The next collections the article listed were BAYC and CryptoPunks, which have almost no laundry trade. This will give a reader the impression that Terraforms is more of a popular collection than the blue chip collections as in reality there were almost no organic trades.
By filtering trades for wash trades, traders, analysts and investors can more accurately evaluate NFT assets and the industry. Having accurate datasets and using them are two separate things. My role here is not to warn or break the NFT myths, I am here to share my knowledge and tell my side of the story to everyone.
Using this article, I will submit a request to analyze data from CEX NFT marketplaces. Binance or Bybit NFT Marketplace would be ideal.


