The decline continues, what is the price of the bottom?
Bitcoin, Ethereum and XRP all shared the same bearish narrative with prices plunging by double digits in the weekly window.
A major market decline, following the FTX-Binance drama, led to market-wide panic selling that sent Bitcoin and altcoin prices down. The Bitcoin price was hovering at $17,564 at press time, falling over 20% in the past three days.
Ethereum and XRP followed BTC as their price fell below key support zones. While Bitcoin, Ether and XRP all presented a slight uptick in price, price action remained massively bearish in the hourly time frame.
How Deep Can Bitcoin Losses Go?
The FTX disaster triggered heavy market losses as the Bitcoin price tested the all-time low of $15,580. The $15,500 level was last seen by BTC in November 2021, after which the Bitcoin price regained momentum as a bull rally began.
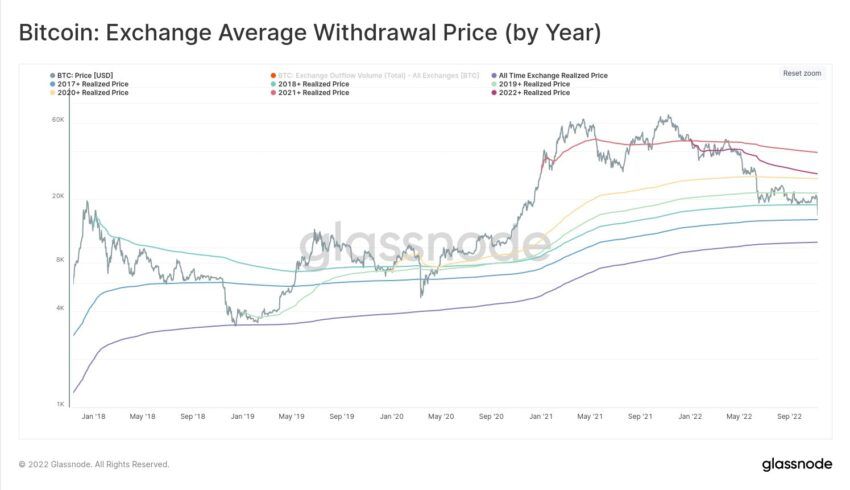
Data from Glassnode highlighted that near the $15,700 level, only investors from the class of 2017 and earlier were profitable. The average exchange withdrawal price since January 1 of each year suggested that the class of 2018 support at the $18,500 mark was lost.
Bitcoin’s supply losses this year were also on par with the Black Swan event of 2020 and the final peak of 2018.
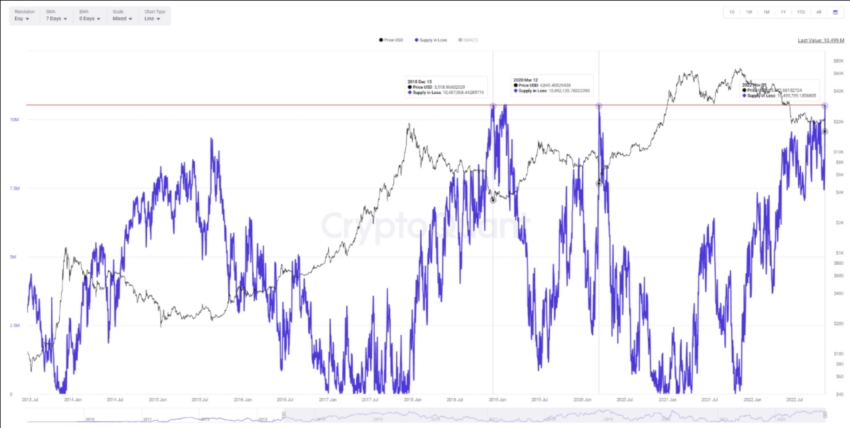
The amount supplied in a loss in November this year was around 10,499,799, while it was 10,492,135 in 2020. Investors’ losses were so great that it was difficult to assess how long the market will take to recover.
Although the BTC price rose by over 5.11% on the hourly chart, Bitcoin mining values suggested that there was still immense pain. In particular, the Hash Ribbons index was at an all-time high.
However, Bitcoin mining volume gradually decreased, which may seriously affect miners.
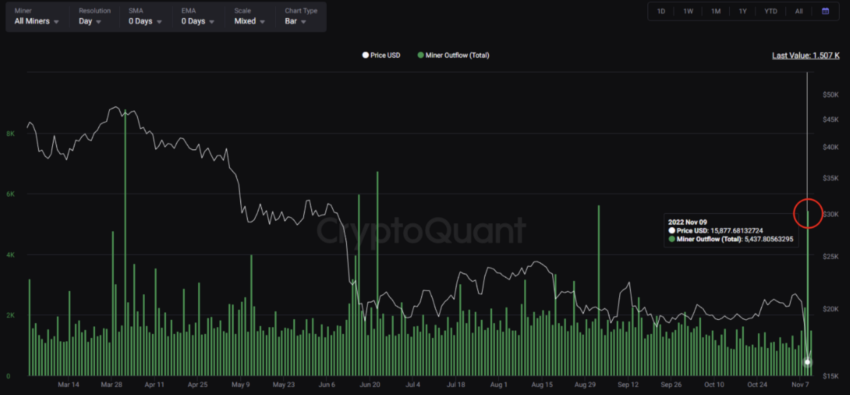
On November 9, around 5,437 BTC were withdrawn from the Miner Outflow Index. This can be interpreted as miners increasing the selling pressure in the market.
Bitcoin whales redistribute
Going forward, if the mining withdrawal table shows that the miner withdrawal is rising, the BTC price may fall further.
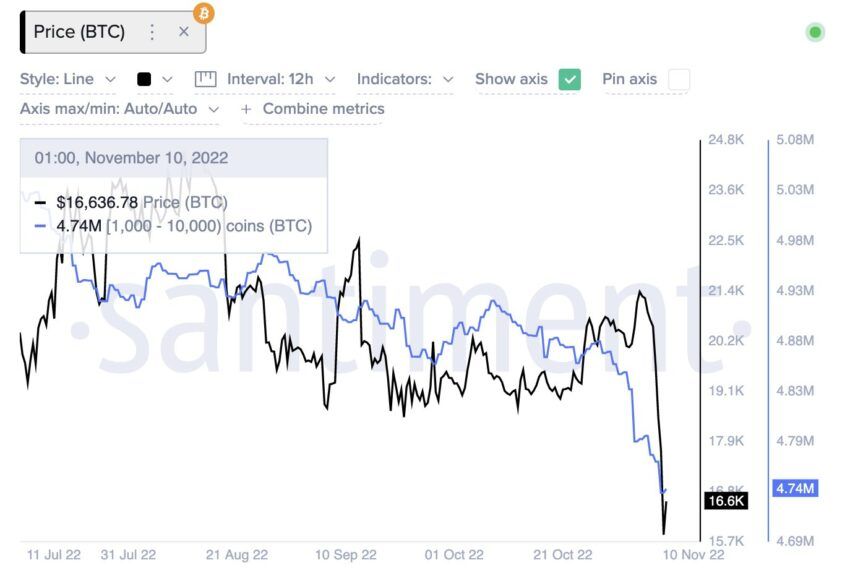
Bitcoin whales were also more cautious this time around. BTC whales with 1000 to 10,000 BTC were seen selling or redistributing. This cohort of whales redistributed around 140,000 BTC in the last two weeks, worth approximately $2.25 billion.
With whale and miner behavior looking increasingly suspicious, it cannot therefore be said that a bottom is in.
Going forward, with short-term price momentum improving, IntoTheBlock’s In/Out Of Money Around price indicator suggested strong support for the Bitcoin price at the $17,095 mark where 447,000 addresses hold 417,000 BTC.
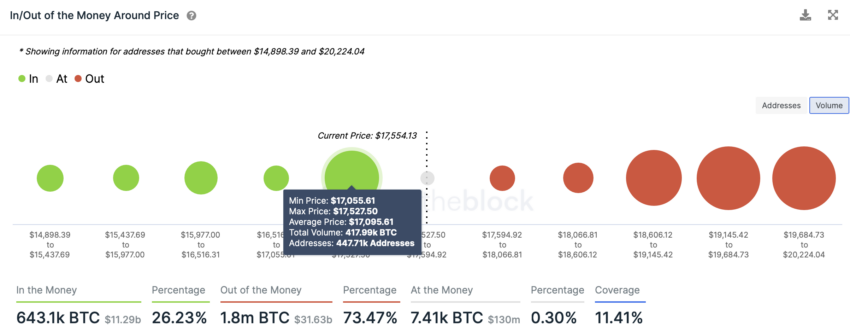
However, if the Bitcoin price fell below the $17,000 mark, there does not appear to be any major support before the $15,000 range.
Ethereum is trying to recover
Both Ether and XRP recorded one of the most notable price declines below key support levels. At press time, however, the Ethereum price was up 7.19% while XRP’s price was up 2.11% in the daily window.
The losses were not as severe for ETH as they were for Bitcoin and some other altcoins this time. In fact, ETH price held above $1000 psychological support level.
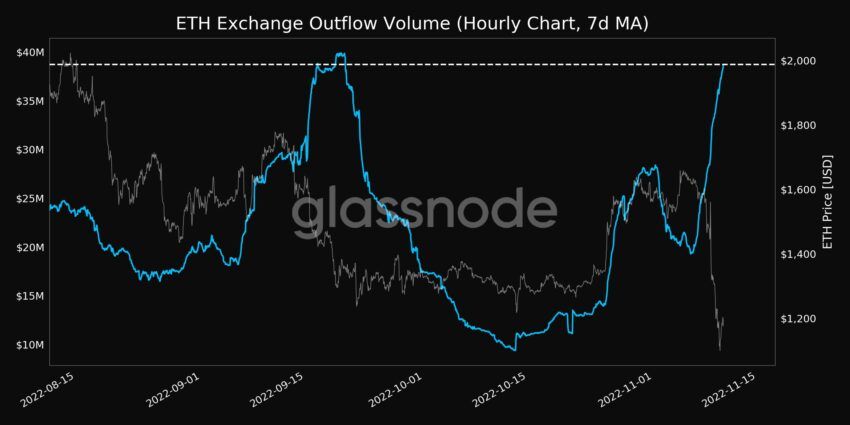
Despite bears taking over, ETH Exchange Outflow Volume hit a 4-month high of 26,377,735 ETH. Increase in outflow volume was largely an indication that Ether left the exchange.
Two of the largest ETH whale cohorts hold 100,000 – 1 million coins and 1 million to 10 million coins redistributed or sold. Data from Santiment highlighted that these groups reduced their holdings by nearly 1.3 million ETH to over $1.3 billion at press time.
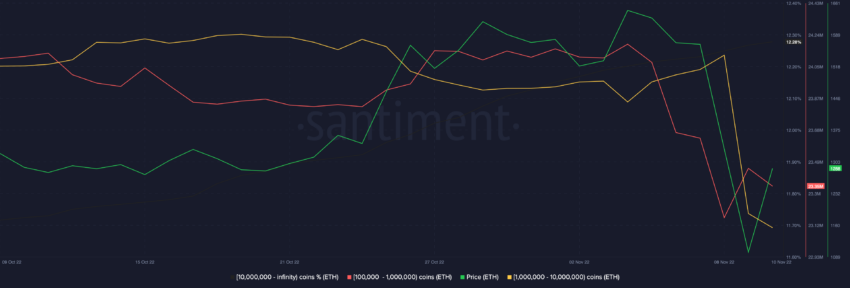
Going forward, if the ETH price can establish resistance above $1350 along with a return of whales to the scene, some relief can be expected.
The growth of the XRP network
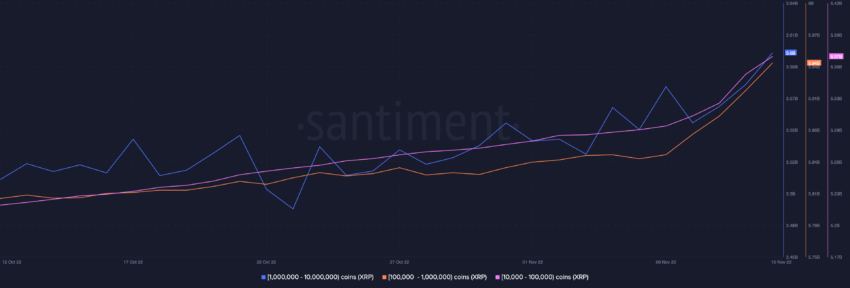
XRP price was still down 14.63% on the weekly chart, but presented some gains on the short-term chart. As shown below, the XRP whales were not deterred by the recent market crash, in fact, two of the largest XRP whale groups piled up some XRP.
XRP’s network growth saw one of the most notable spikes making a new all-time high.
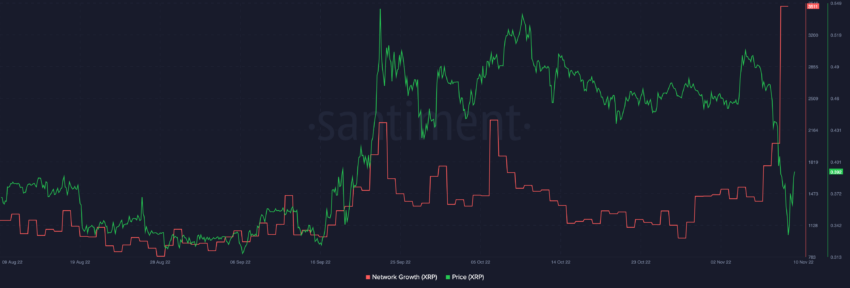
However, the price still had a long way to go, with the XRP price in a prolonged downtrend due to the ongoing regulatory battle.
For XRP price, the next major resistance will be at the $0.40 mark while the $0.30 mark still acts as strong support.
Nevertheless, with the larger market still looking volatile, much will depend on macro market conditions.
Disclaimer: BeInCrypto strives to provide accurate and up-to-date information, but it will not be responsible for missing facts or inaccurate information. You comply and understand that you should use this information at your own risk. Cryptocurrencies are highly volatile financial assets, so do your research and make your own financial decisions.
Disclaimer
All information on our website is published in good faith and for general information purposes only. Any action the reader takes on the information contained on our website is strictly at their own risk.


