Crypto markets are falling, but the worst is yet to come
- The Bitcoin price underwent a massive selloff on August 9th and is halfway through the July 26th and 30th rally.
- The Ethereum price is likely to fall more before any meaningful recovery comes.
- The XRP price continues to undo gains to find a stable support level.
The Bitcoin price is trying to reverse the rally it has seen over the past week and is currently in the middle. This selloff has caused Ethereum and Ripple prices to follow suit, halting the gains experienced by altcoins.
Going forward, things are likely to cool down for BTC, potentially giving altcoins an opportunity to attempt a recovery.
Bitcoin price is losing ground
Bitcoin price crashed 7.5% in the last 24 hours and is currently testing the 200-week Simple Moving Average (SMA) at $22,877. A break of this level and the 30-day Exponential Moving Average (EMA) at $22,737 will signal the start of the second leg down.
However, a minor rally to $23,624 is likely to occur before a move to $21,140 or $21,115.
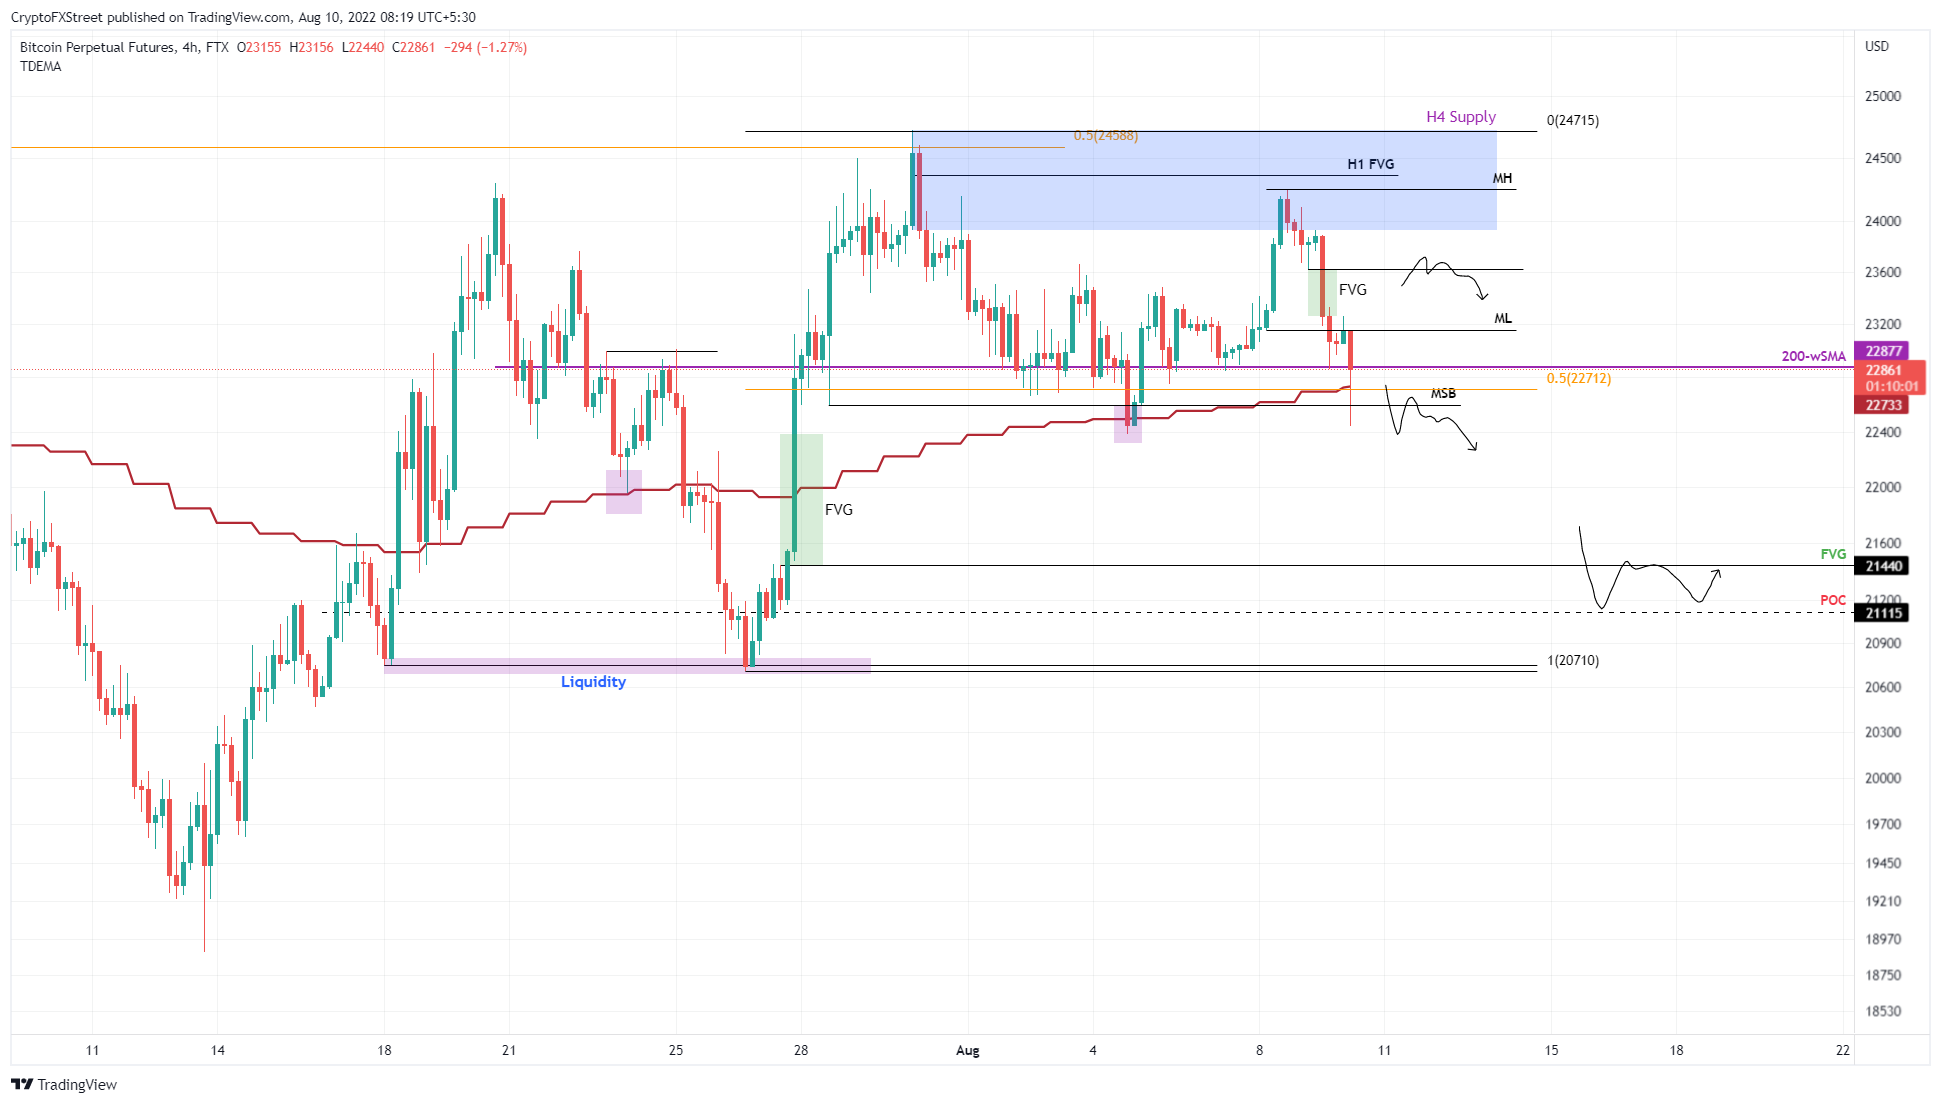
BTC/USDT 4-hour chart
A daily candlestick above the $24,565 resistance level will invalidate the bearish thesis for the Bitcoin price. In such a case, BTC may try to go back to the psychological level of $28,000.
Ethereum price follows BTC down the hill
Ethereum price took a cue from Bitcoin price and has crashed 9.4% in the last 24 hours. This development stops when BTC hovers above the 30-day EMA and 200-week SMA. Therefore, investors should be prepared for a possible move to $1,466. However, this decline could occur after a brief retest of the $1,761 level.
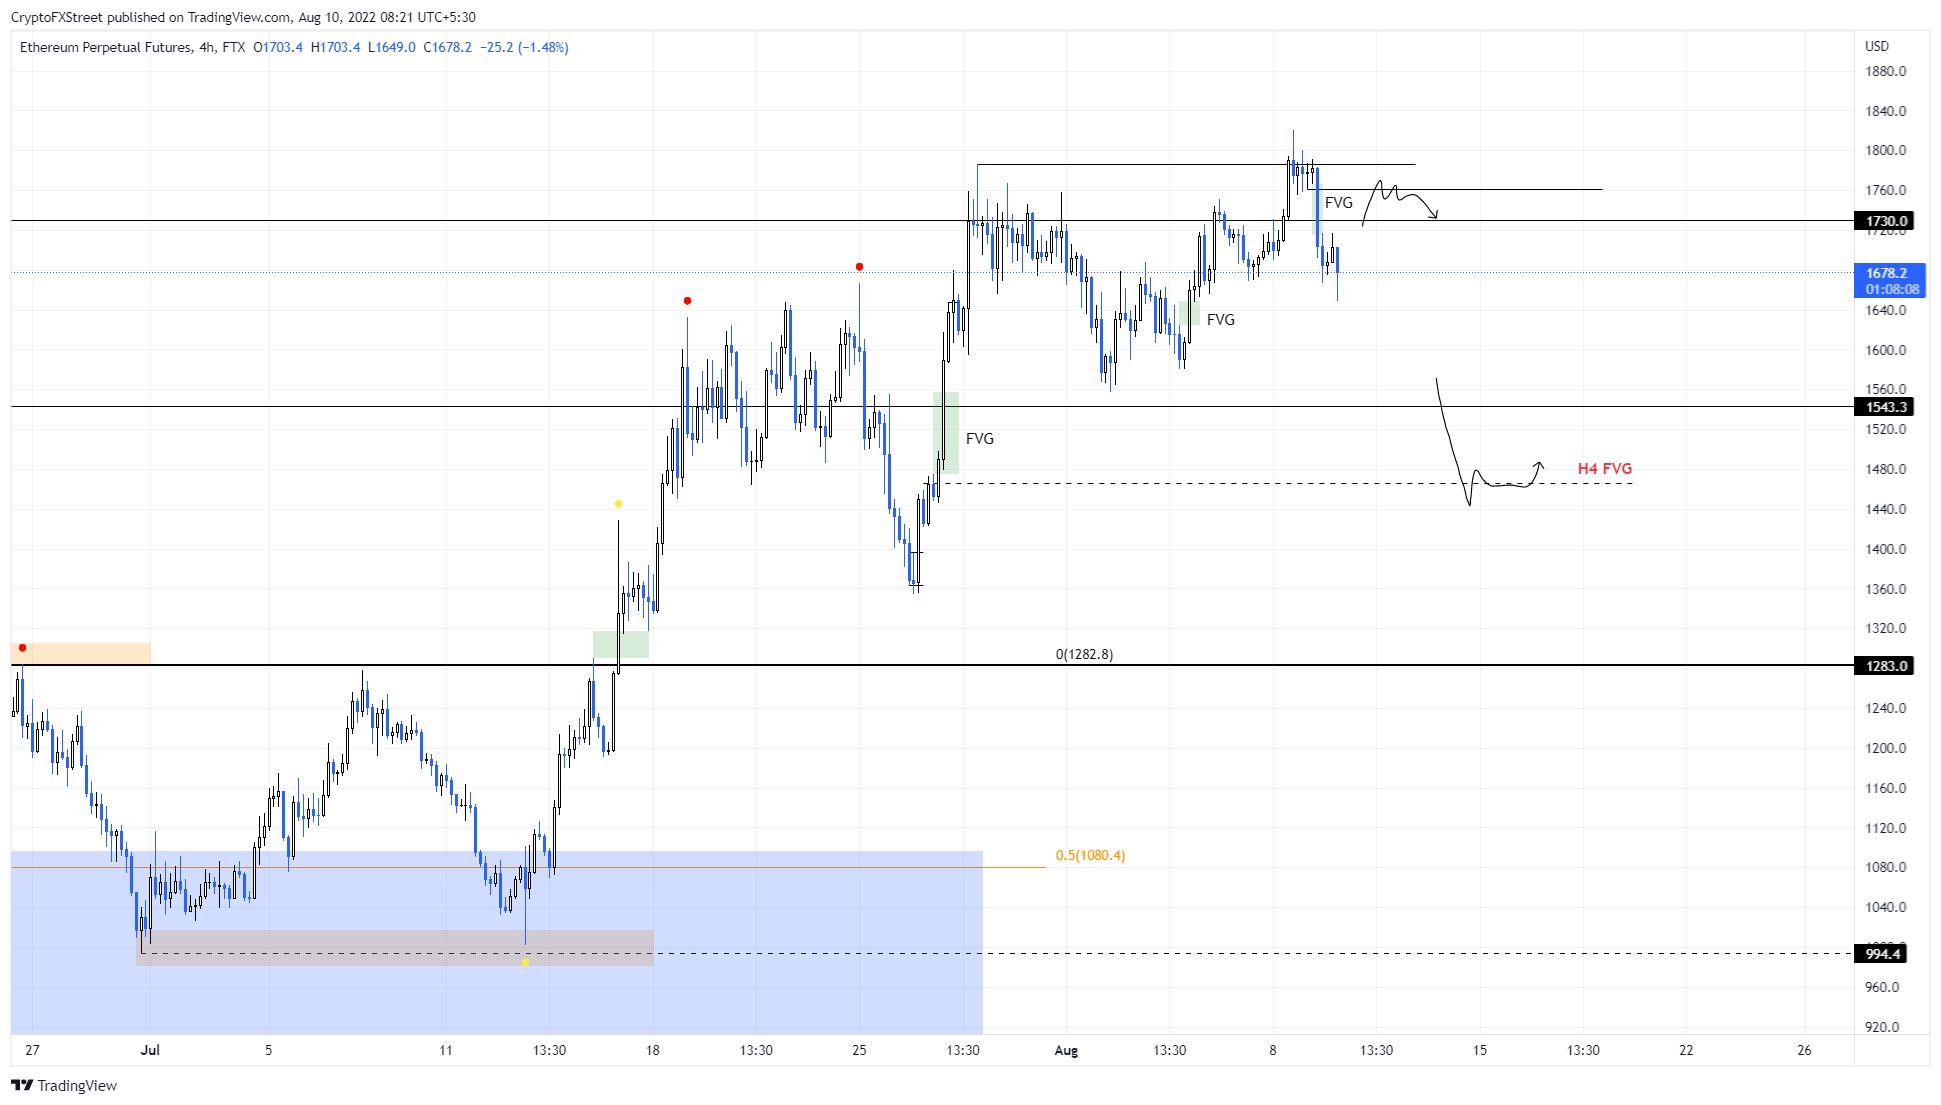
ETH/USDT 4-hour chart
On the other hand, if the Ethereum price manages to hold above the $1,730 support level, it will invalidate the bearish thesis. In such a case, ETH may return to the psychological level of $2000.
XRP price needs stable ground
XRP price is trying to repair leaks after the fourth rejection at the $0.381 resistance level. This move is likely to push the XRP price to the $0.340 support level. A breakdown of this level, in a very bearish case, could push the remittance token down to the $0.287 to $0.311 demand zone.
This decline would also collect the sell-stop liquidity resting below the same lows formed at $0.326.
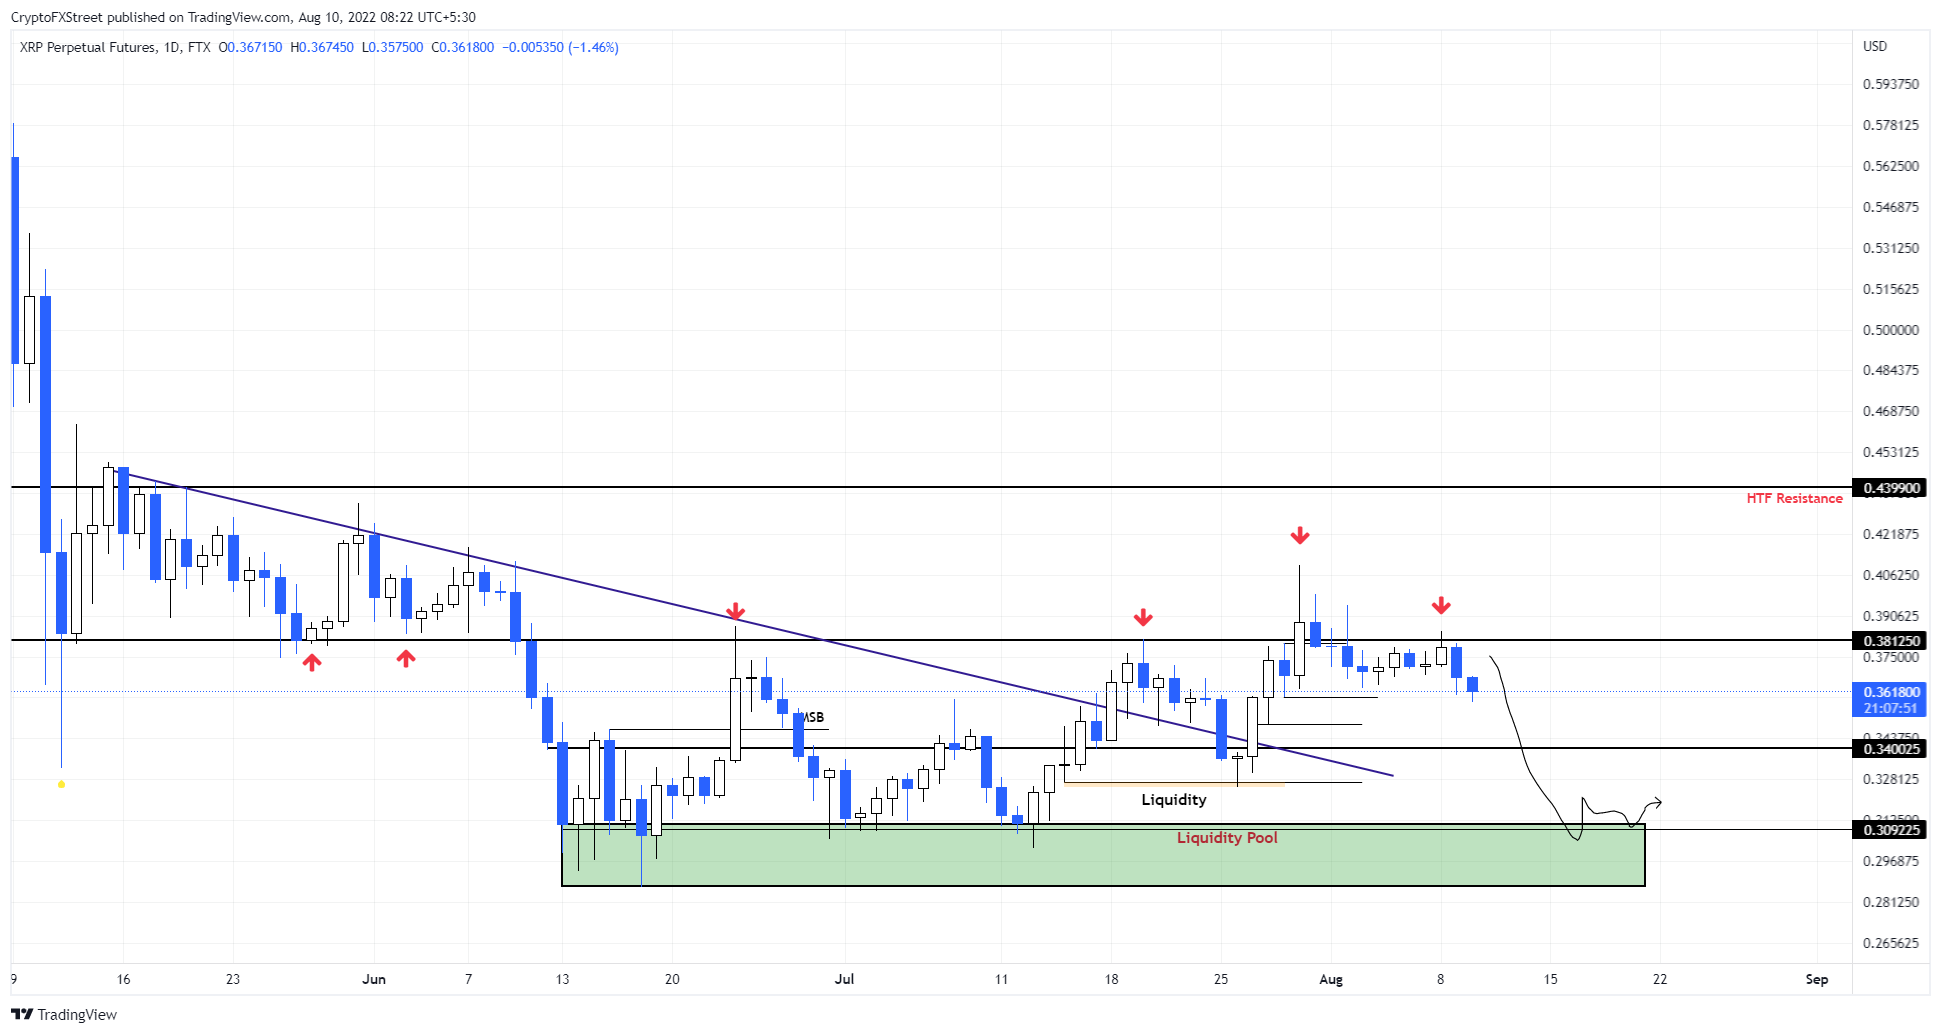
XRP/USDT 1-Day Chart
Regardless of the bearish outlook, a premature rally could happen at $0.340. However, only a decisive reversal of the $0.381 level into a support floor will invalidate the pessimistic view of Ripple.
In this situation, the XRP price may attempt a quick rally to $0.439.


