Selling pressure at overhead resistance, could it weigh on the bullish momentum? – Cryptopolite
Bitcoin price analysis reveals that selling pressure is beginning to weigh on the bullish momentum seen in recent hours. BTC is currently sitting below its previous support at $23,800. This marks a significant retracement when the asset hit highs near $26,000. As Bitcoin has fallen, it has found some temporary support near $22,700, but traders will be closely watching this level .

At the same time, overhead resistance has formed at the $23,800 zone. This could pose a problem for BTC as it struggles to break higher. The cryptocurrency is currently trading just above its 50-day moving average. If buyers fail to push through this resistance area in the coming hours, a deeper pullback could be on the cards.
Bitcoin has formed a bearish crossover between its 50 and 200-day moving averages. This is seen as a sign of weakened bullish momentum that could push BTC prices further in the near term. Bitcoin is trading at $23,252.28, down 1.16 percent in the last 24 hours.
BTC/USD analysis on a daily chart: Bears overwhelm the bulls
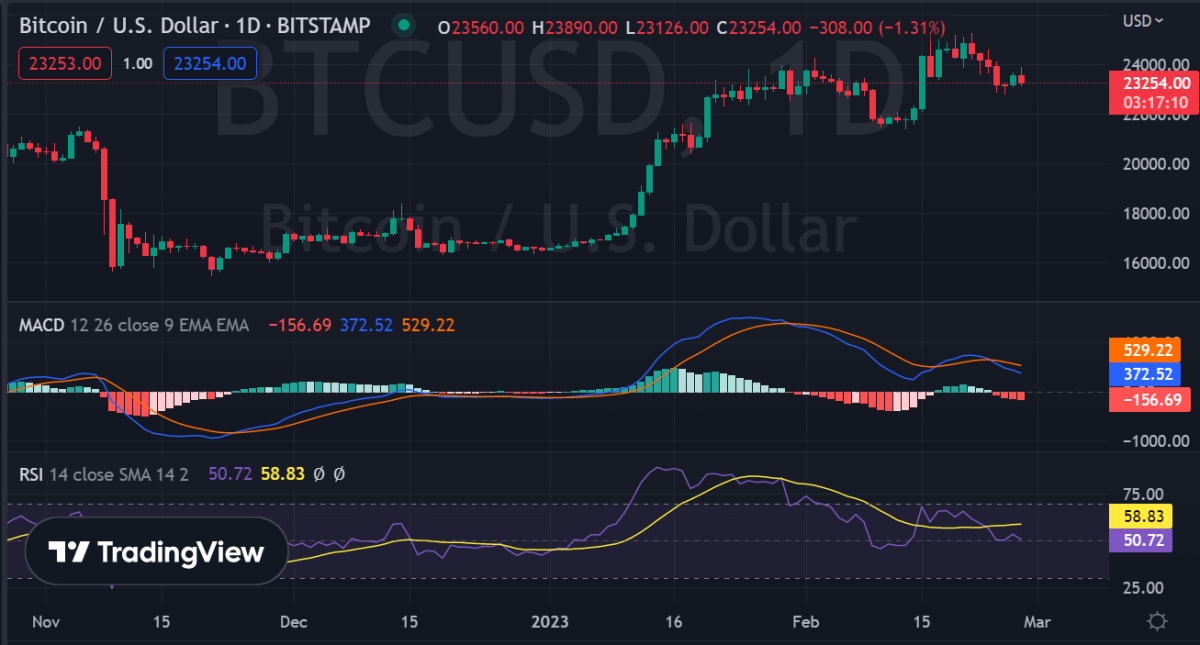
On a daily chart, Bitcoin price analysis reveals that the BTC/USD pair is searching for support at $22,700 as it pulls back from previous highs. The 50-day moving average has crossed below the 200-day moving average, signaling that selling pressure is currently outweighing buying interest. Bitcoin opened today’s trading charts at an intraday low of $23,213.85 and managed to rally higher towards the $24,857 level before falling sharply as bears took control.
At the same time, BTC has now entered a bearish trend on its daily chart as it faces several levels of overhead resistance. The US stock markets and Bitcoin are trying to start the week on a positive note, but the latest price action shows that the bulls are still struggling with momentum.

On February 25, Bitcoin managed to surge past the $22,800 support level before surpassing the 20-day EMA ($23,417) two days later on February 26. This indicates that a steady build-up of buyers is occurring at lower price levels – a promising sign for investors.
The technical indicators also favor a bearish outlook, with the Relative Strength Index (RSI) trending lower and currently sitting at 50.87 and the MACD in bearish territory.
Bitcoin Price Analysis on a 4-Hour Chart: Bulls Can’t Challenge 200-Day MA
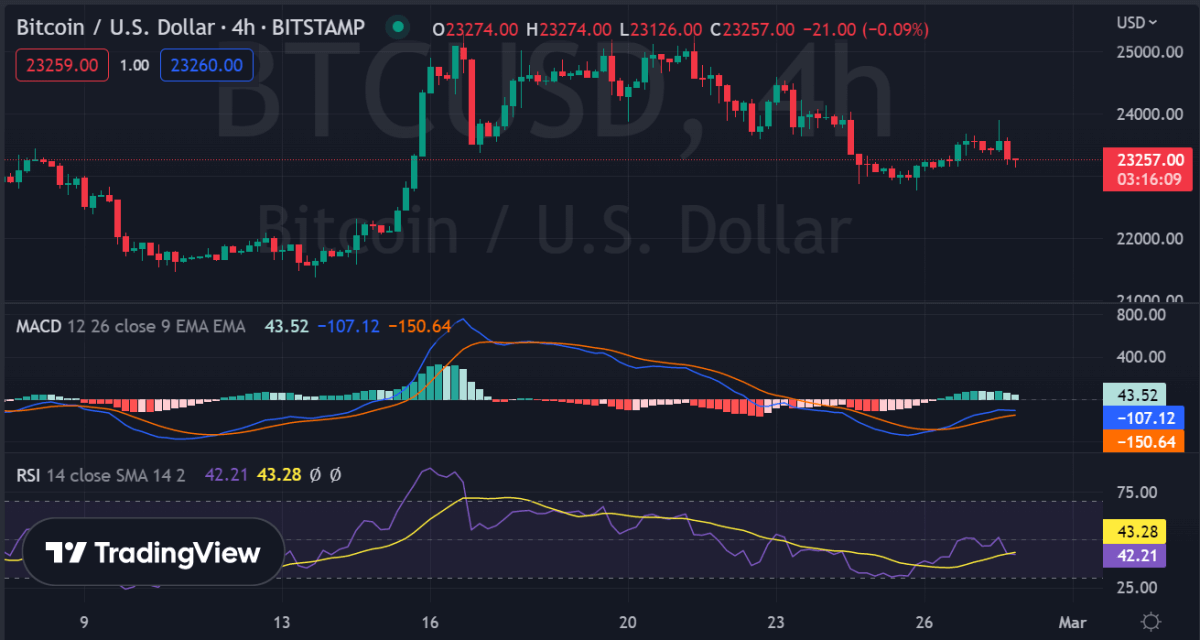
A 4-hour Bitcoin price analysis chart reveals that BTC/USD is trading just above its 50-day moving average. The asset is trying to break higher but has faced resistance at the 200-day MA ($23,540). At the time of writing, the bulls seem unable to challenge this overhead resistance and a deeper pullback could be on the cards.

The RSI is also trending lower and currently sits at 48.21 while the MACD line is below the signal line, indicating a bearish divergence in momentum.
Bitcoin price analysis conclusion
Bitcoin price analysis for today reveals that the asset is struggling to break higher mid-overhead resistance. The cryptocurrency has retreated below its previous support of $23,800 and is trying to find a floor near $22,700. Technical indicators also favor a bearish outlook, with no signs of recovery in sight.
While you wait for Bitcoin to move forward, check out our price estimates on XDC, Polkadot and Curve


