Cryptoanalyst Sees $100,000 for Bitcoin’s Near-Term Price After This Pattern Emerges ⋆ ZyCrypto


Bitcoin hitting a price of $100,000 is a prediction many cryptocurrency players have made in the past. While the asset has never reached that level before, many expect Bitcoin’s popularity, and inherent value, to play a big role in sending the asset to $100,000 or even higher.
While Bitcoin at $100,000 has yet to become a reality, and price predictions that have followed since last year have been mostly modest, one key player in the market highlights strong opportunities for Bitcoin.
According to the analyst, a recent pattern has been spotted on Bitcoin’s technical chart. Bitcoin could more than triple its current price levels if the pattern fully forms. The top cryptocurrency could soon go as high as $100,000.
Charles Edwards, the cryptocurrency analyst and also the founder of Capriole Investments Fund, took to Twitter to make this known to his 100,000+ Twitter followers. Edwards, a full-time Bitcoin analyst, revealed that a textbook bullish pattern known as the “Bump & Run Reversal” has been spotted on Bitcoin’s technical chart.
As the textbook pattern explains, the cryptoanalyst shared: “Different components of the bump-and-run reversal bottom. A price drop follows the entry phase, where prices move in a narrow range. The bump is then formed rounding upwards as prices leave the bowl and move higher in the uphill and go back to new heights.”
In the meantime, it is important to remember that while chart patterns may point to the possibility of a bullish run for cryptocurrencies, they may also fail and the asset in question may fall to an even lower price level or remain stagnant in the short term or long term.
“It goes without saying, but chart patterns fail, don’t use this as a trading/investment plan. Manage your risks!” Charles Edwards warned in a follow-up tweet.
Meanwhile, Bitcoin had previously enjoyed a brief bull run at the start of the week, with the asset’s price soaring to new highs. Bitcoin earlier hit a seven-month high of $26,514 before losing momentum.

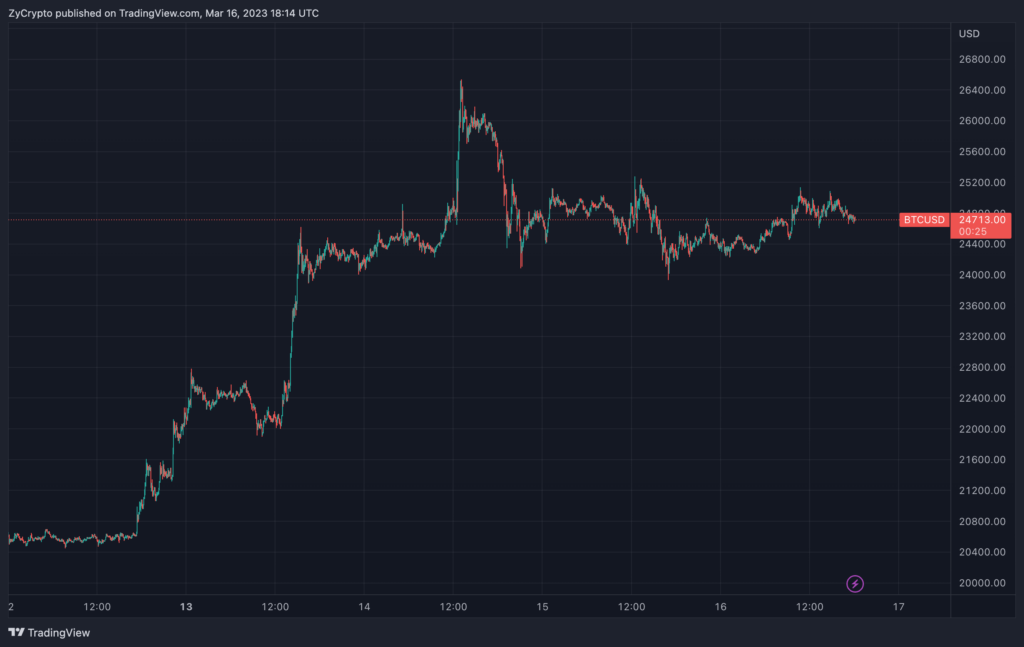
The asset fell as losses piled up and fell below $25,000. This came after a large number of long positions were liquidated. Data from Coinglass revealed that more than $150 million in long positions were liquidated. Bitcoin is now trading at a press time price of $24,735.


